Polkadot Rises above $6.37 after Emerging from Its Decline
Estimated Reading Time: 2 minutes
Don’t invest unless you’re prepared to lose all the money you invest. This is a high-risk investment and you are unlikely to be protected if something goes wrong. Take 2 minutes to learn more

Polkadot (DOT) Long-Term Analysis: Bullish
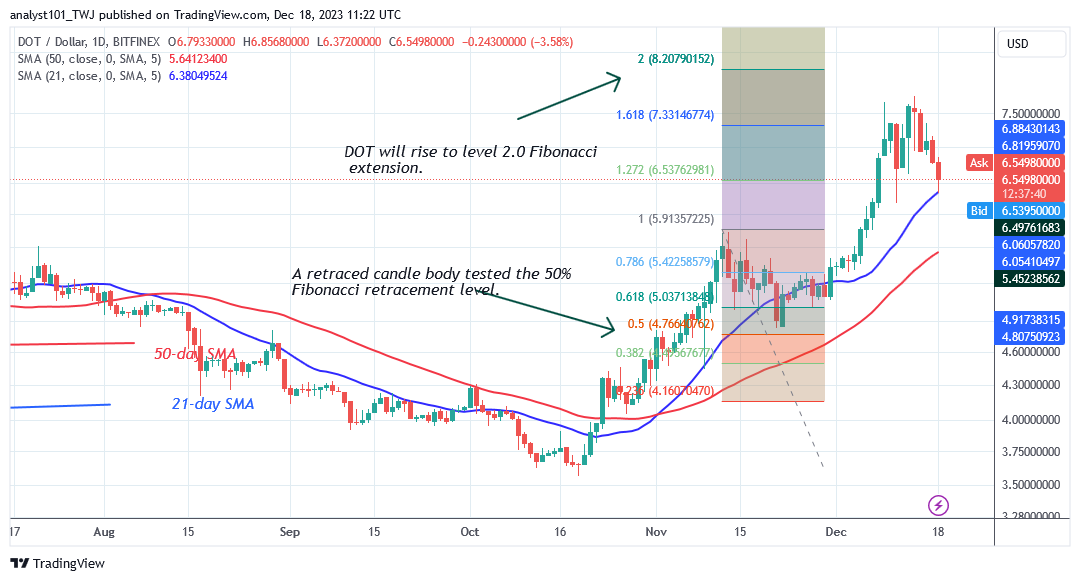
Polkadot (DOT) has dropped twice above the 21-day simple moving average as it emerged from its decline. The bulls have stopped the downward trend above the moving average lines. The market will remain above the 21-day SMA and will retest or break the resistance at $7.68. In other words, the altcoin’s price has been oscillating between $6.40 and $7.40.
On the downside, the current retracement has stopped above the $6.37 support level. The price of DOT is anticipated to rise. DOT/USD will hit $8.20 if the latest high is breached. On the other hand, a breakdown of the $6.40 low or the 21-day SMA will indicate that a downturn has resumed. The fall will begin with a low above the 50-day SMA, or $5.70.
Technical indicators:
Major Resistance Levels – $10, $12, $14
Major Support Levels – $8, $6, $4
Polkadot (DOT) Indicator Analysis
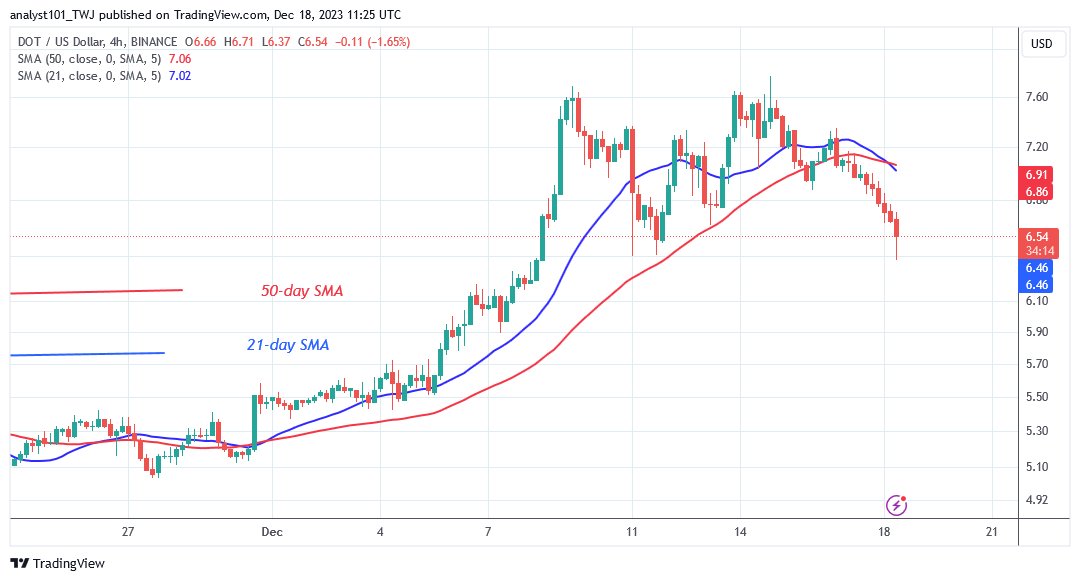
DOT price retraced above the 21-day simple moving average and recovered. The price bars remain above the ascending moving average lines. The price bars on the 4-hour chart are below the moving average lines, indicating an earlier fall.
What Is the Next Direction for Polkadot (DOT)?
Polkadot is trading sideways on the 4-hour chart as it emerges from its decline. Following the termination of the uptrend on December 9, the market has remained in a sideways trend. The price of the altcoin is between $6.40 and $7.60. The bears attempted to breach the lower price range on December 18, but the bulls purchased the dips.
The cryptocurrency has rebounded from its slump to resume its range-bound movement.
You can purchase Lucky Block here. Buy LBLOCK
Note: Cryptosignals.org is not a financial advisor. Do your research before investing your funds in any financial asset or presented product or event. We are not responsible for your investing results