Polkadot Veers below $7.68, Indicating a Potential Downturn
Estimated Reading Time: 2 minutes
Don’t invest unless you’re prepared to lose all the money you invest. This is a high-risk investment and you are unlikely to be protected if something goes wrong. Take 2 minutes to learn more

Polkadot (DOT) Long-Term Analysis: Bullish
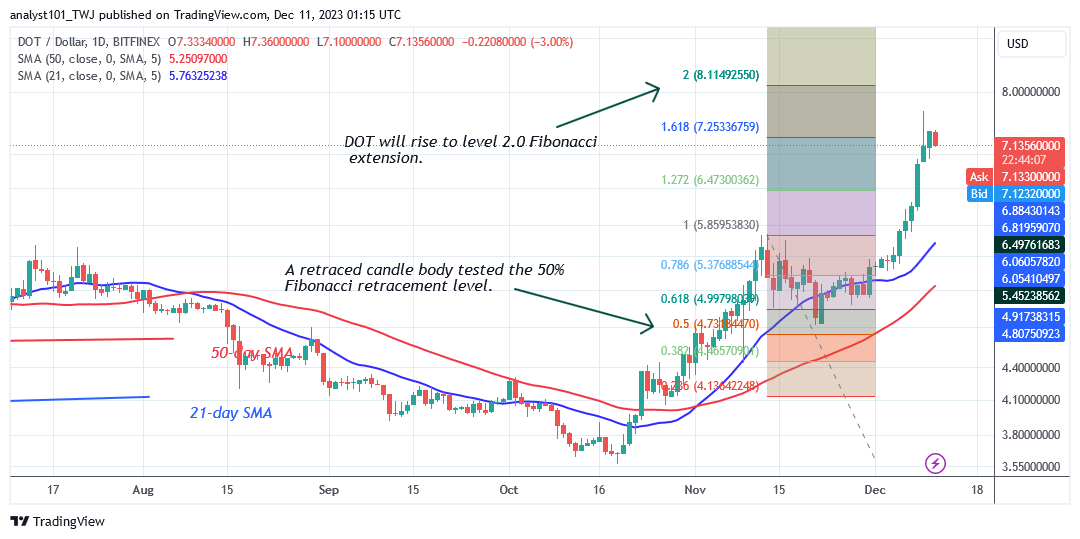
Polkadot (DOT) price has remained bullish above the 21-day SMA but indicates a potential downturn. The first uptrend ended on December 9 after reaching a high of $7.68. Polkadot has been ranging between $7.00 and $7.50 since December 9. For the past five days, price movement has been restricted above the moving average lines.
According to the price signal, the altcoin has the potential to rise above the barrier level. DOT/USD will appreciate further to a high of $8.11 or the level 2.0 Fibonacci extension. On the negative, if the cryptocurrency retraces and falls below the 21-day SMA, the price of DOT will fall to $4.82.
Technical indicators:
Major Resistance Levels – $10, $12, $14
Major Support Levels – $8, $6, $4
Polkadot (DOT) Indicator Analysis
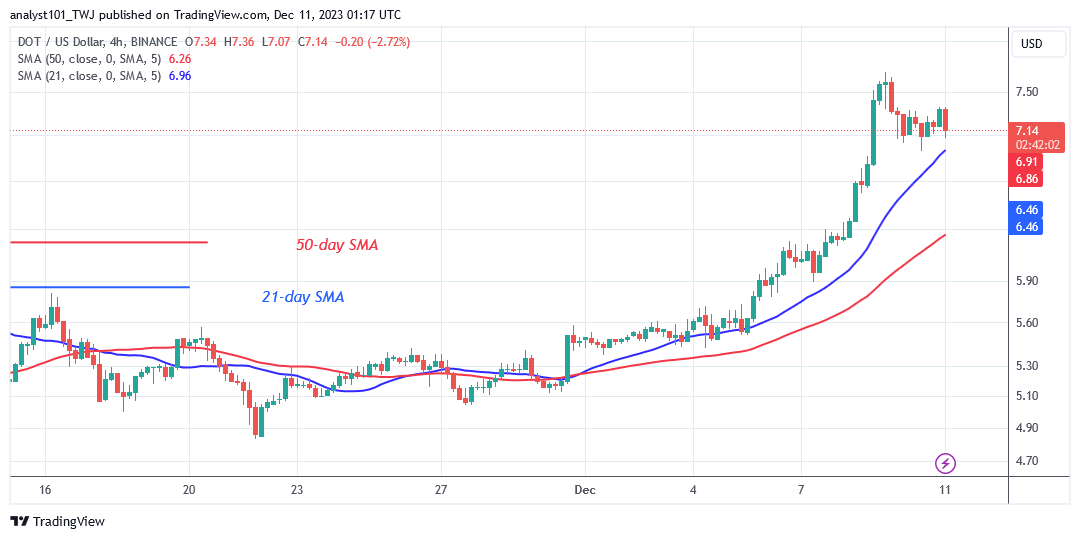
DOT price retraced and found support above the 21-day moving average line on the 4-hour chart. Although the retracement ended above the moving average line, it is currently consolidating above it. As a result, the present rise is expected to continue as buyers defend the existing support. The cryptocurrency might find it difficult to rise higher as it approaches the overbought area.
What Is the Next Direction for Polkadot (DOT)?
Polkadot’s ascent has momentarily ceased but indicates a potential downturn. The market is trading below the barrier level but above the 21-day simple moving average. When these levels are breached, the altcoin will trend. The cryptocurrency is currently overbought, therefore the upward movement has been minimal. The present price level is stable above the $7.00 support level.
You can purchase Lucky Block here. Buy LBLOCK
Note: Cryptosignals.org is not a financial advisor. Do your research before investing your funds in any financial asset or presented product or event. We are not responsible for your investing results