XRP (XRP/USDT) Prepares for More Upside Movement
Estimated Reading Time: 3 minutes
Don’t invest unless you’re prepared to lose all the money you invest. This is a high-risk investment and you are unlikely to be protected if something goes wrong. Take 2 minutes to learn more
XRP Long-term Analysis: Bullish
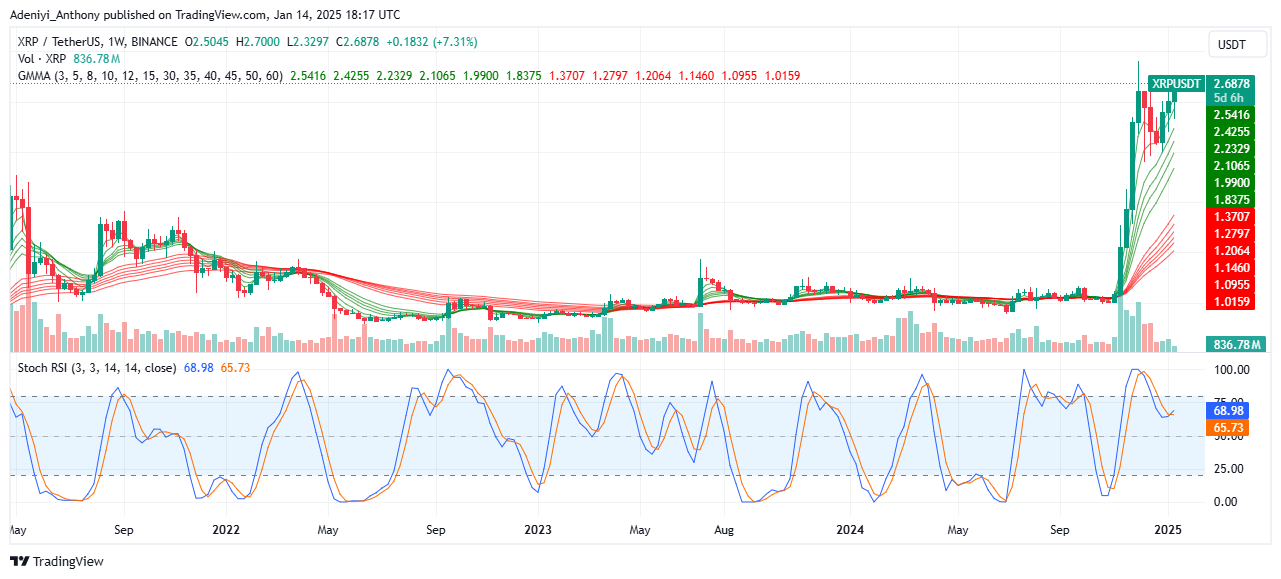
XRP against the Tether on a weekly timeframe has recently experienced a significant bullish breakout after recovering from a short-term price dip. However, this sharp rally is supported by strong trading volumes, indicating renewed buying momentum with the potential to hit the $3.000 psychological level soon.
Recently, the price actions have bounced above the widened Guppy Multiple Moving Averages (GMMAs), confirming a strong bullish interest. However, with the oscillator near the overbought region, a potential retracement or consolidation may follow. Traders should monitor price actions around the $2.7500 or immediate support level to make proper decisions.
Currently, XRP trades at $2.6878 with over 800 million weekly traded volumes.
Technical Indicators
Major Resistance Levels: $2.750, $3.000, and $3.500
Major Support Levels: $2.425, $2.107, and $1.838
XRP Technical Analysis
The analysis of XRP against the Tether shows that the pair has recorded a 7.31% gain this week after the previous week’s price dip. This signals the pair has experienced a significant rally as prices move above prior resistance levels.
The GMMAs suggest a strong bullish movement with the current divergence, as the trading volume bar within the chart shows the market condition is bullish.
On the other hand, the Stochastic RSI operates near the overbought zone, suggesting the pair has the potential to improve further with the possibility that the price may slow down in the near term.
On this note, a break above the $2.750 resistance level would confirm more upside movement; otherwise, the price may oscillate around the current level.
XRP/USDT Analysis: What’s Next?
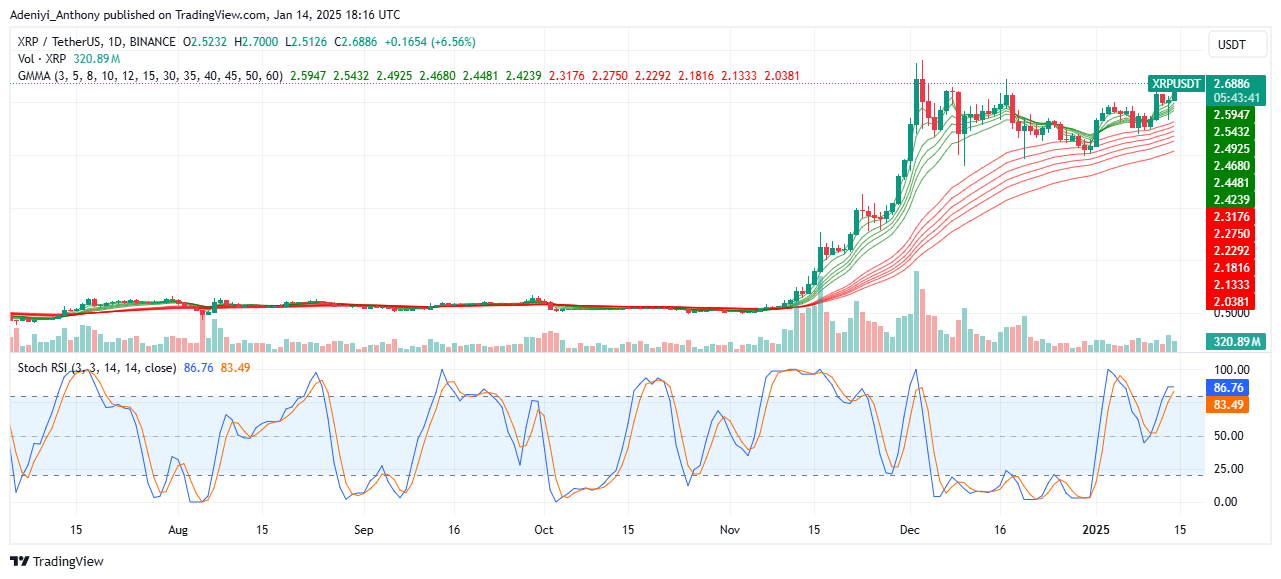
On the daily timeframe, XRP/USDT signals a short-term gain, as the pair remains bullish. With a moderate trading volume of over 300 million, the GMMAs project upward with a relatively tight line. This indicates a sustained trend strength.
On the other hand, the oscillator at the bottom of the chart shows the pair operating deep in the overbought region. Therefore, soon a retest of the immediate support level may surface.
To this end, a break below $2.600 would indicate a potential retracement despite the bullish position.
You can purchase crypto coins here. Buy LBlock