Origin Protocol (OGN/USD) Converges Around the Historic $0.07328
Estimated Reading Time: 3 minutes
Don’t invest unless you’re prepared to lose all the money you invest. This is a high-risk investment and you are unlikely to be protected if something goes wrong. Take 2 minutes to learn more
The price level of $0.07328 has emerged as a critical point in the Origin Protocol market. This significance became evident when the market broke out of a period of indecision that spanned from June 21 to July 23. During those trading days, the market exhibited robust bullish momentum, quickly reaching its peak at the $0.15000 price level, which marked the inception of the subsequent bearish trend.
Nevertheless, despite the initial bearish trend, a strong presence of bullish sentiment has since slowed down the descent, extending the bear market for nearly a month before the price retraced back to the key support level of $0.07328.
Origin Protocol Market Data
- OGN/USD Price Now: $0.07624
- OGN/USD Market Cap: $41,871,447
- OGN/USD Circulating Supply: 559,633,046 OGN
- OGN/USD Total Supply: 1,000,000,000 OGN
- OGN/USD CoinMarketCap Ranking: #380
Key Levels
- Resistance: $0.0800, $0.08200, and $0.08300.
- Support: $0.0700, $0.06800, and $0.06600.
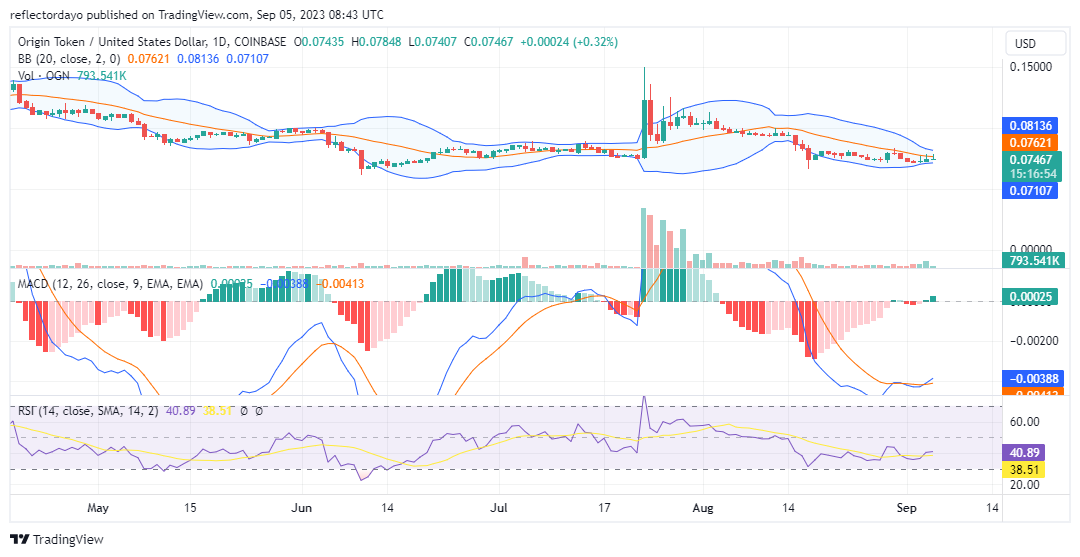
Price Prediction for Origin Protocol: The Indicators’ Point of View
The Origin Protocol market is currently hovering around the critical $0.0752 price level, with the Bollinger Bands converging in its vicinity. This convergence suggests the potential for a rebound from this level. The bull market began to exhibit signs of increased activity yesterday, as indicated by a slightly stronger volume histogram compared to previous days. Additionally, the formation of an inverted hammer in yesterday’s market suggests that traders may not be inclined to let the price drop below the current support level.
The Moving Average Convergence and Divergence (MACD) indicator has recently experienced a bullish crossover below the zero level, signaling a shift in market dynamics. Combined with the converging Bollinger Bands, there is a likelihood of an impending bounce in the near future.
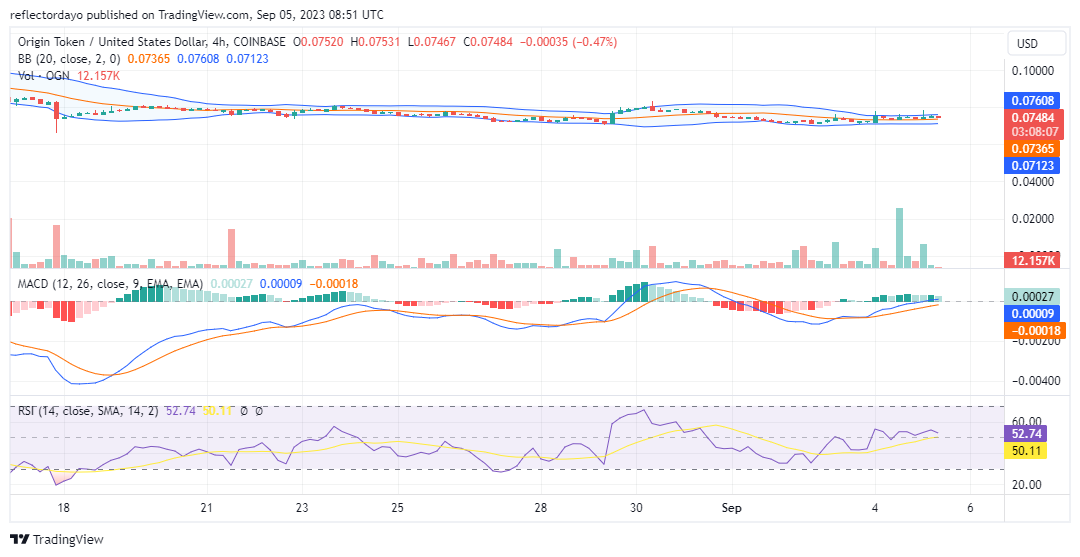
OGN/USD 4-Hour Chart Outlook
On the 4-hour chart, the Origin Protocol is currently trading within a tight price range. However, the volume of trade indicator has been registering significant spikes in the form of large histograms. This suggests the potential development of bullish momentum, as the ongoing volatility compression could lead to a substantial breakout in the near future. From this perspective, several indicators depict the market as being at an equilibrium level.
Nevertheless, when examining the Relative Strength Index (RSI), it becomes apparent that the market is slightly positioned above the 50 mark. Traders should be vigilant and monitor the possibility of a breakout occurring above the nearby resistance level at approximately $0.07642.