Bancor (BNTUSD) Is Fluctuating Around a Significant Level
Estimated Reading Time: 2 minutes
Don’t invest unless you’re prepared to lose all the money you invest. This is a high-risk investment and you are unlikely to be protected if something goes wrong. Take 2 minutes to learn more
BNTUSD Analysis – Price Is Fluctuating Around the $3.850 Level
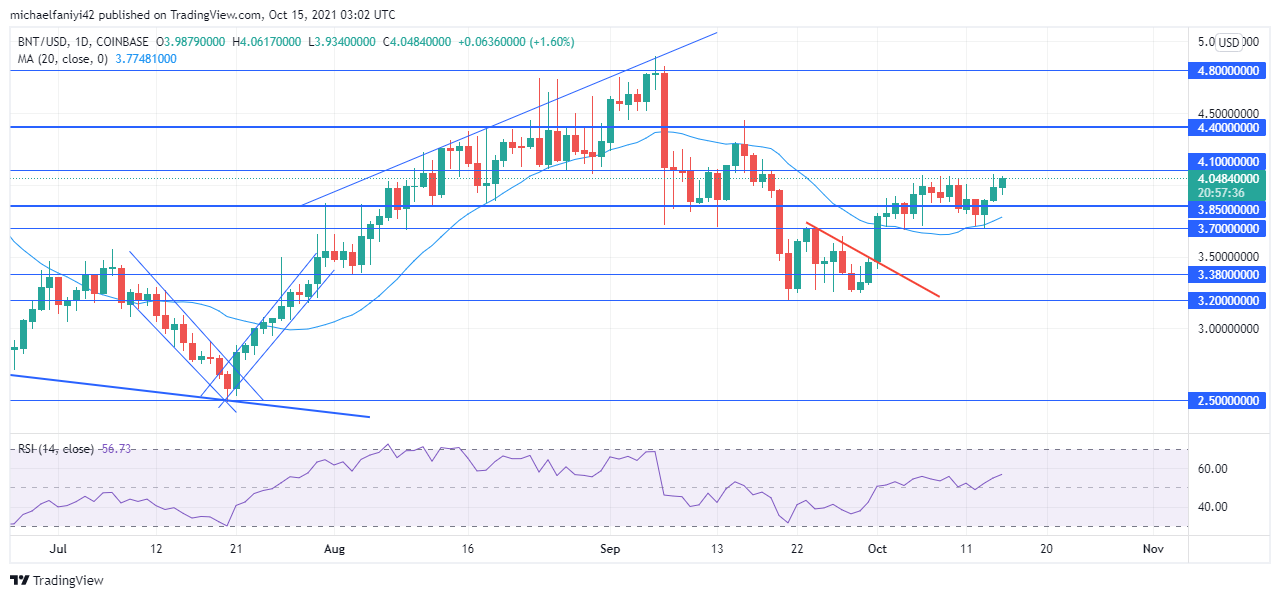
BNTUSD is fluctuating around a significant price level of $3.850. This comes after the market broke to the upside of a descending triangle on the 1st of October. After the coin broke out, price rose rapidly to $3.850. A pullback to the support at $3.700 helped the market climb above $3.850. This happened only for the coin to drop below the level and climb again in a fluctuating movement.

BNTUSD Key Level
Resistance Levels: $4.100, $4.400, $4.800
Support Levels: $3.380, $3.700, $3.850
The market has been dropping since it reached the $4.800 price level on the 7th of September. However, the bulls didn’t let the market down without a scuffle. The coin can be seen fluctuating at every level the market drops to. Firstly, it was at the $4.100 significant level. The price was also seen fluctuating at $3.700, eventually tapering into a triangle pattern, which bulls exploited.
BNTUSD is set to adopt the same method to climb up. Bulls are struggling to wrest control from sellers, which will result in consolidations at various significant levels. Currently, the market is fluctuating around the $3.850 significant level. The MA period 20 (Moving Average) has slid below the daily candlesticks to act as support for the market. The RSI (Relative Strength Index) has now climbed above the middle 50 mark, which shows a switch of momentum to the bulls.
Market Prospects
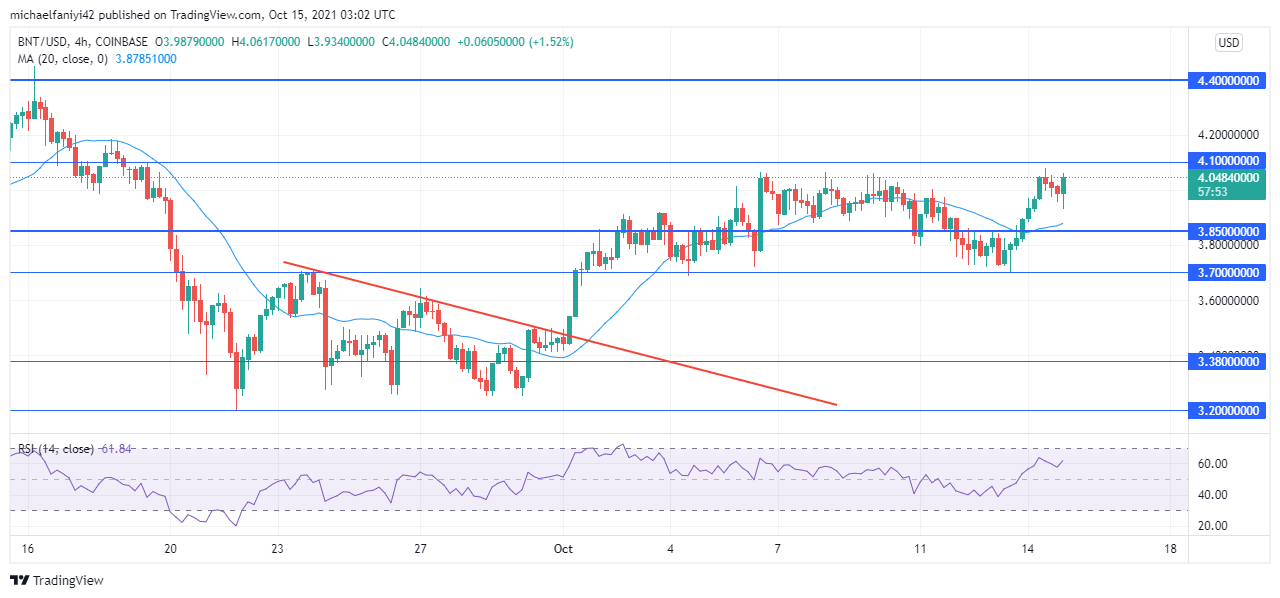
On the 4-hour chart, the fluctuation of price can be seen as it slides up and down the $3.850 significant level. The Relative Strength Index indicator is strongly bullish after it climbs to 57. There is, however, a drawback currently in the market. This could see the coin retest the $3.850 key level for a higher level, or the price could fall below the key level again to continue fluctuating.
As bullish momentum grows, the coin is expected to push upward to another consolidation zone, most likely $4.400.
You can purchase crypto coins here: Buy Tokens
Note: Cryptosignals.org is not a financial advisor. Do your research before investing your funds in any financial asset or presented product or event. We are not responsible for your investing results.