Ethereum (ETH) Retraces, Faces Rejection From $3,272 Overbought Region
Estimated Reading Time: 2 minutes
Don’t invest unless you’re prepared to lose all the money you invest. This is a high-risk investment and you are unlikely to be protected if something goes wrong. Take 2 minutes to learn more
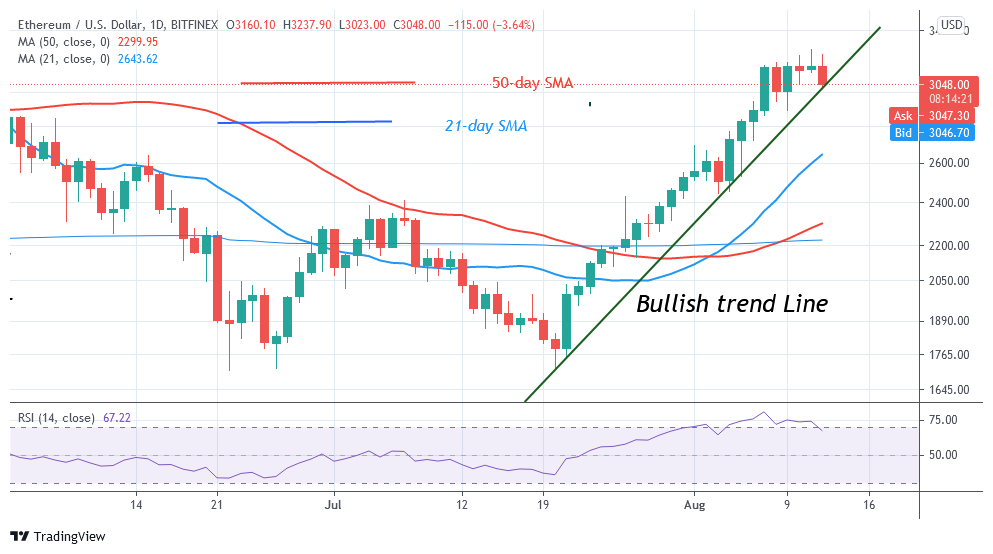

Ethereum Price Long-Term Analysis: Bullish
On August 11, Ether rallied to $3,272.20 high, retested it twice, and fell to the low of $3,140. The downtrend resumes as price corrected upward to retest the $3,240 resistance. Sellers were attracted at the overbought region as ETH/USD resumed a downward move. The current downtrend is likely to extend to the low of $2,900. If the $2,900 support holds, the market will resume an upward move. However, if the selling pressure persists, Ether will fall to $2,880 low.
Ethereum Indicator Analysis
Ether price is attempting to break below the bullish trend line. A break below the line will accelerate the selling pressure. Besides, if the bears break below the moving averages the downtrend can be terminated. Meanwhile, Ether is has fallen below the 20% range of the daily stochastic. It indicates that the biggest altcoin has reached the oversold region of the market. The selling pressure is likely to subside.
Technical indicators:
Major Resistance Levels – $2, 600, $2,800, $3,000
Major Support Levels – $1.500, $1, 300, $1,100
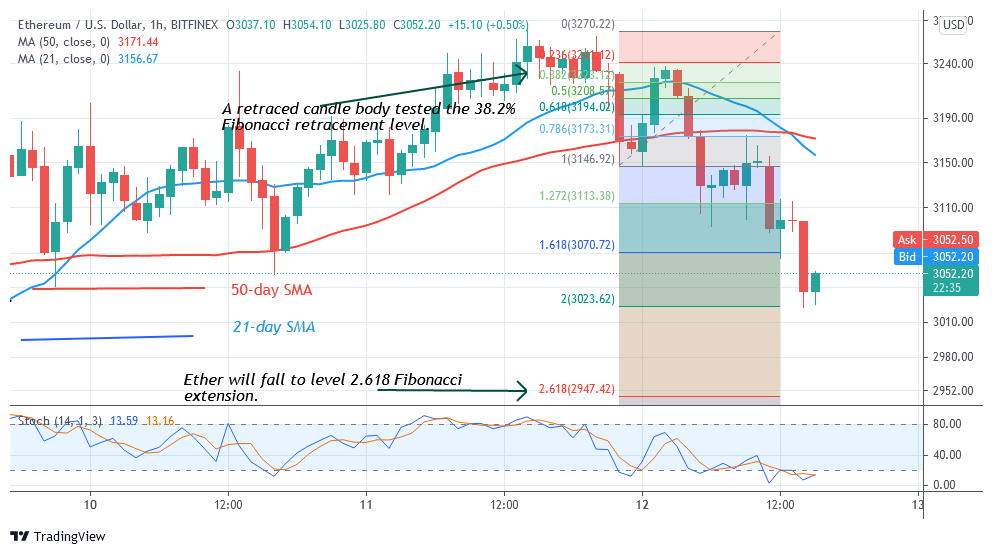
What Is the Next Direction for Ethereum?
Ethereum is in a downward move. Today, the biggest altcoin has reached the low of $2,981. Meanwhile, on August 11 downtrend; a retraced candle body tested the 38.2% Fibonacci retracement level. The retracement indicates that ETH is likely to fall to level 2.618 Fibonacci extension or level $2,947.42. From the price action, Ether has fallen to $2,981.30 as buyers attempt to push price upward.
You can purchase crypto coins here. Buy Token
Note: Cryptosignals.org is not a financial advisor. Do your research before investing your funds in any financial asset or presented product or event. We are not responsible for your investing results