Ethereum (ETH) Breaches the $2,320 Resistance, Targets the $2,872 High
Estimated Reading Time: 2 minutes
Don’t invest unless you’re prepared to lose all the money you invest. This is a high-risk investment and you are unlikely to be protected if something goes wrong. Take 2 minutes to learn more

Ethereum Price Long-Term Analysis: Bearish
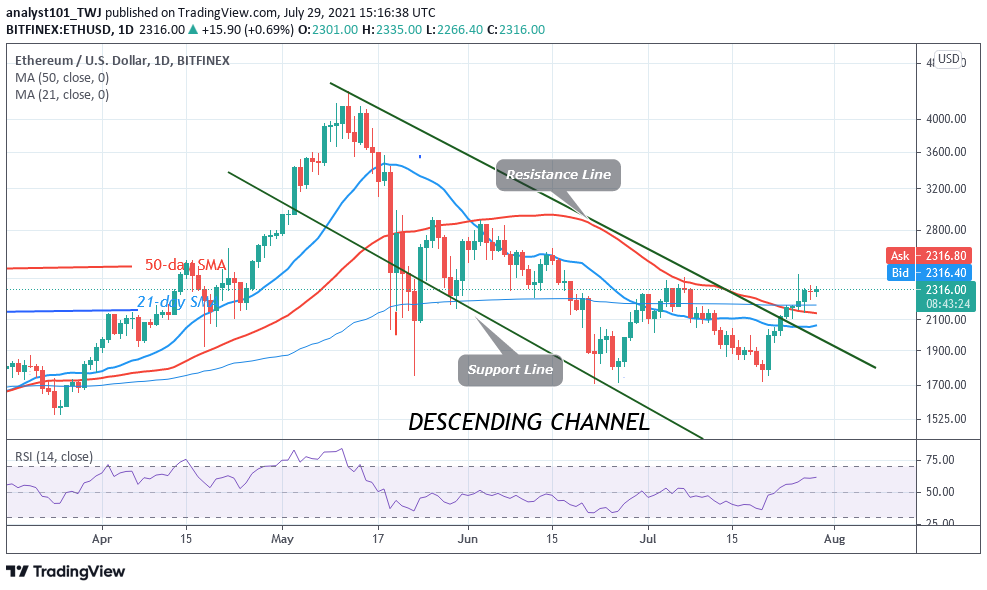
Ether price is in an upward move as price attempts to break the initial resistance at $2,320. Since July 27 buyers have not been able to break the resistance at $2,320. The biggest altcoin will rise above the $2,400 high if the initial resistance is breached. Presently, Ether’s price has broken above the moving averages which indicate a possible upward move of the coin. The crypto is now in the bullish trend zone. The coin is capable of rising on the upside.
Ethereum Indicator Analysis
Ether price bars are above the 21-day and the 50-day SMA which indicates that the crypto is likely to rise. Ether is at level 61 of the Relative Strength Index period 14. It indicates that the crypto is in the bullish trend zone and above the centerline. Ether is above the 80% range of the daily stochastic. It indicates that the crypto has reached the overbought region of the market.
Technical indicators:
Major Resistance Levels – $2, 600, $2,800, $3,000
Major Support Levels – $1.500, $1, 300, $1,100
What Is the Next Direction for Ethereum?
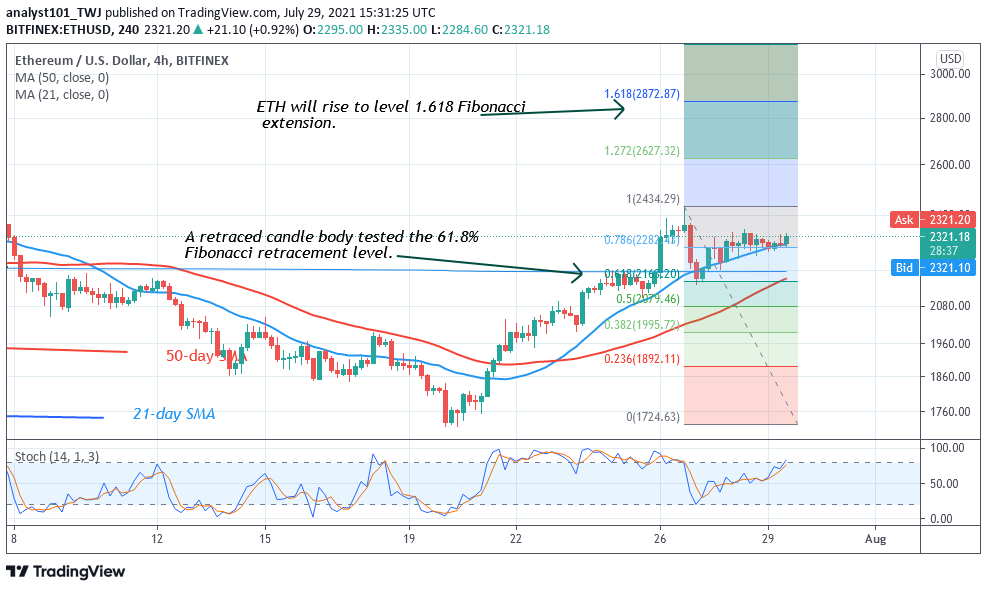
Ethereum is set to resume an upward move as it breaks above the initial resistance at $2,320. Meanwhile, on July 26 uptrend; a retraced candle body tested the 61.8% Fibonacci retracement level. The retracement indicates that ETH is likely to rise to level 1.618 Fibonacci extension or level $2,872.87.
You can purchase crypto coins here. Buy Token
Note: Cryptosignals.org is not a financial advisor. Do your research before investing your funds in any financial asset or presented product or event. We are not responsible for your investing results