Bancor (BNTUSD) Bullish Move Breaks Down as Price Slumps
Estimated Reading Time: 2 minutes
Don’t invest unless you’re prepared to lose all the money you invest. This is a high-risk investment and you are unlikely to be protected if something goes wrong. Take 2 minutes to learn more

Free Crypto Signals Channel
BNTUSD Analysis – Bullish Move Breaks Down as Price Slumps Below $2.500
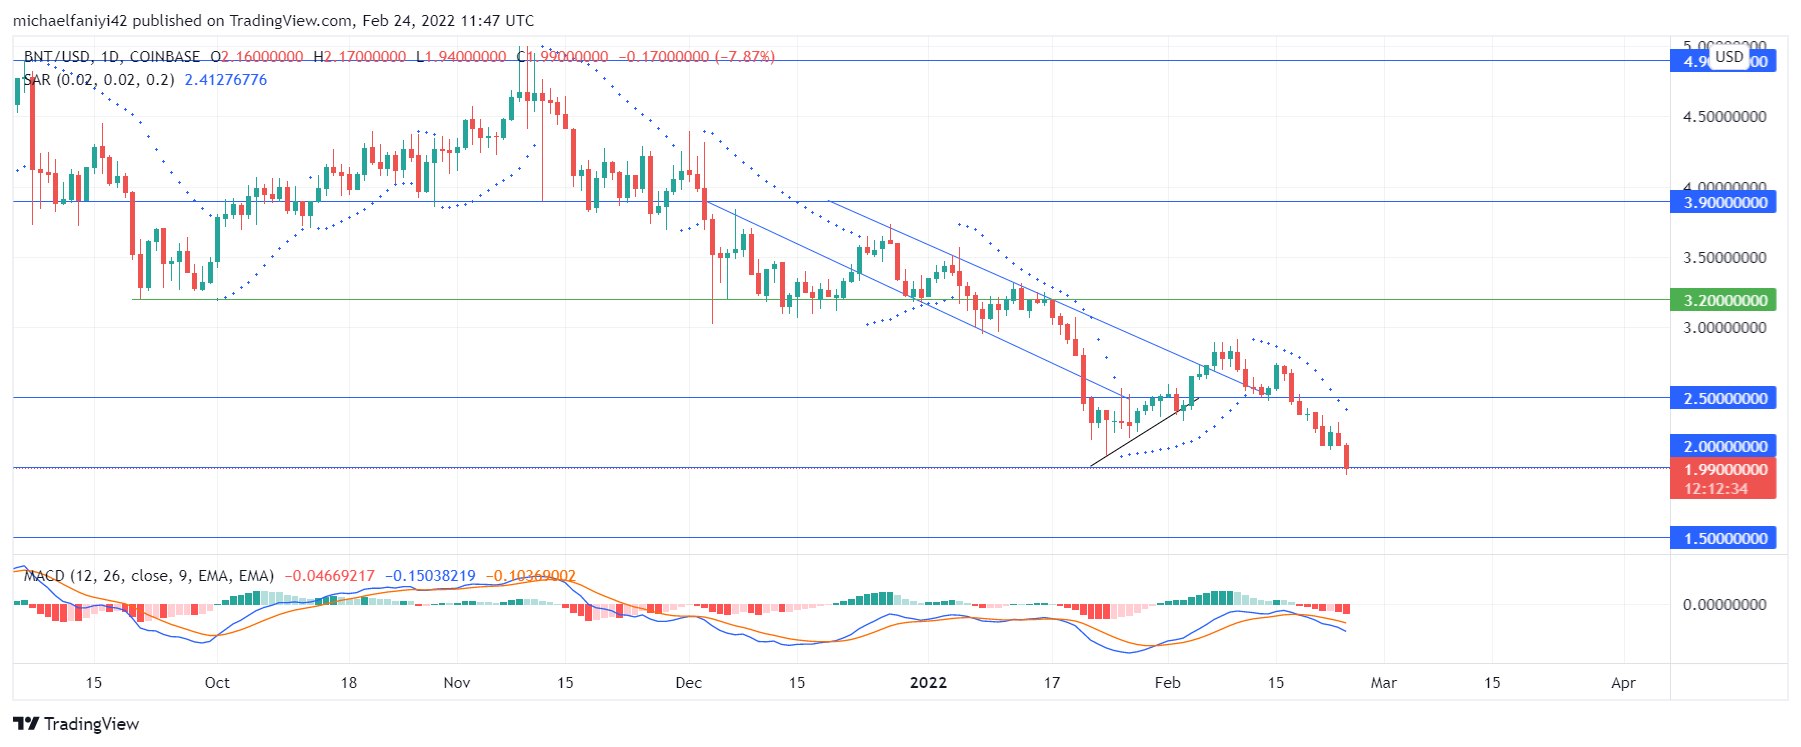
BNTUSD bullish move has broken down after the market could not hold above the $2.500 significant level. Having broken through the upper boundary of its descending channel, the market was primed to regain lost price levels, and a simple retest would have sent the price soaring. But the bulls began to experience weakness, and a second retest took place, following which the coin slumps downward.
BNTUSD Significant Levels
Resistance Levels: $2.500, $3.900
Support Levels: $1.500, $2.000
Bearish dominance of the market stretches as far back as last year. Spectacularly, the price was conducted downward through a conduit at the beginning of the year, and this ended with a slump to the $2.000 support level. The market began to be bullish from this level as buyers tried to push the market up. A triangle pattern was employed to drive the market higher. This was successful as the price jumped above $2.500.
The buyers further pushed the market through the conduit upward. At this point, the market forces intervened to dispose of the buyers of the coin. As a result, the market’s bullishness has broken down as BNTUSD slumps back to $2.000. This has reversed the rise of the Moving Average Convergence Divergence lines with a downward cross. Also, the Parabolic Stop and Reverse have placed its dots above the market to signal a downtrend.
Market Anticipation
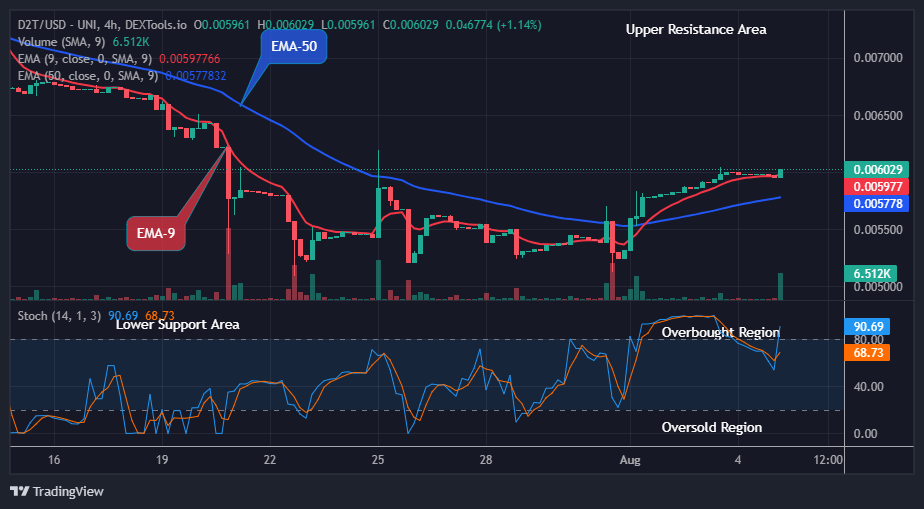
On the 4-hour chart, the price has crashed into the $2.000 price zone, and it is still putting pressure on the support level. The MACD has crossed further downward in its bearish state, and the Parabolic SAR is retaining its dots above the 4-hour candles. All indications point to a failed bullish move, and the bears are set to ride the price down to a lower support line at $1.500.
How To Buy Lucky Block
Note: Cryptosignals.org is not a financial advisor. Do your research before investing your funds in any financial asset or presented product or event. We are not responsible for your investing results.