Quant Price Prediction: QNT/USD Smashes Above $0.120 Resistance Level, What Next?
Estimated Reading Time: 2 minutes
Don’t invest unless you’re prepared to lose all the money you invest. This is a high-risk investment and you are unlikely to be protected if something goes wrong. Take 2 minutes to learn more
Quant Price Prediction – November 30
The Quant price prediction shows that QNT spikes to touch the resistance level of $123 after ranging for a few days.
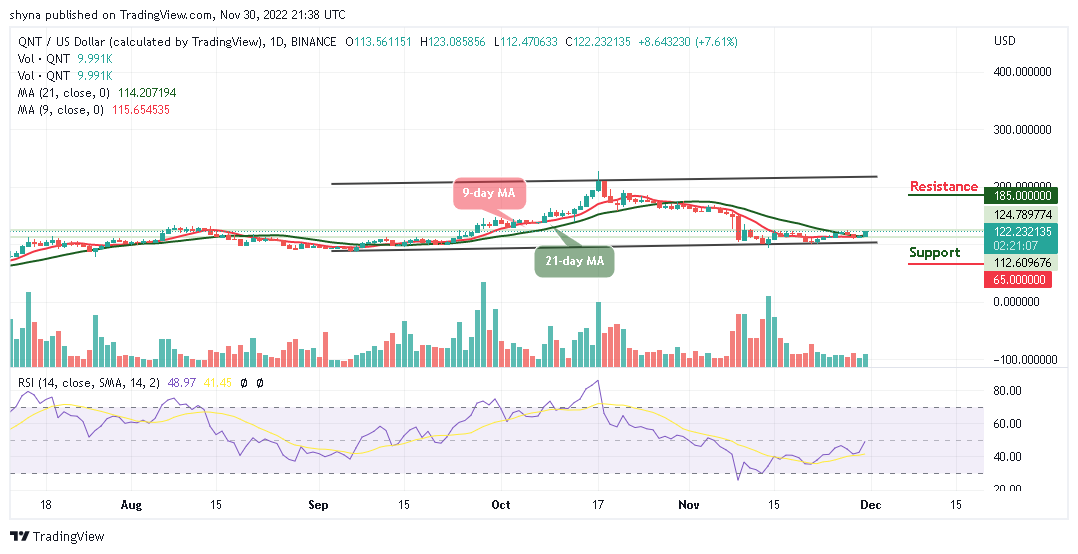
QNT/USD Long-term Trend: Ranging (1D Chart)
Key Levels:
Resistance levels: $185, $205, $225
Support levels: $65, $45, $25
QNT/USD is trading above the 9-day and 21-day moving averages as the coin touches the daily high at $123. However, if the trading volume increases significantly, a bullish run will continue to play out within the channel. Following the recent price, the Quant is currently facing a potential resistance above the $125 level. A break above this level would produce a huge green candle towards the upper boundary of the channel which could hit the potential resistance levels of $185, $205, and $225.
Quant Price Prediction: QNT Will Break More Upsides
The Quant price is moving bullishly as the coin begins a new upward movement within the channel. If the coin continues, it will hit the nearest resistance level of $125. Meanwhile, a bearish step back may roll the market back to the downside with a possible break down to $65, $45, and $25 supports; this could give room for new buyers to come into the market. Moreover, the technical indicator Relative Strength Index (14) confirms the bullish movement as the signal line moves to cross above the 50-level.
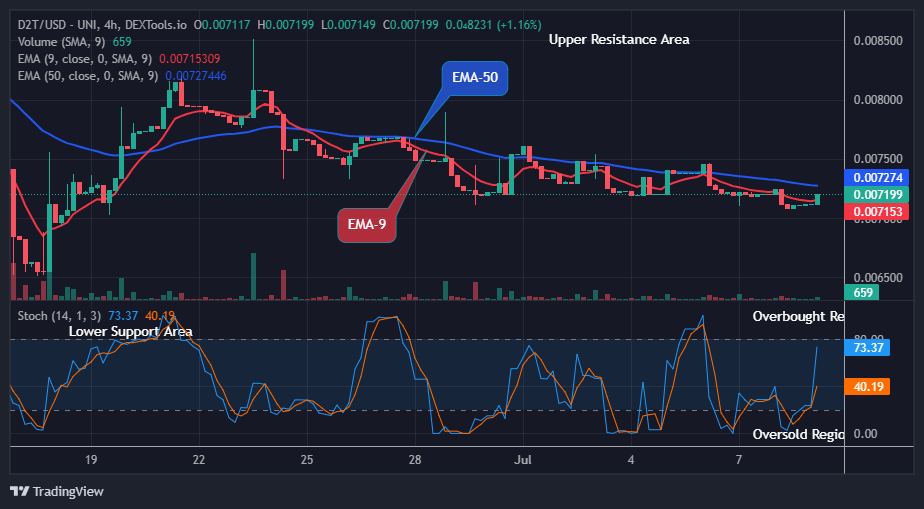
QNT/USD Medium-term Trend: Bullish (4H Chart)
According to the 4-hour chart, the Quant price is well above the 9-day and 21-day moving averages. As it is now, the bulls are seen moving with full force, trading at $122.1 and moving toward the upper boundary of the channel, ready to break more hurdles.
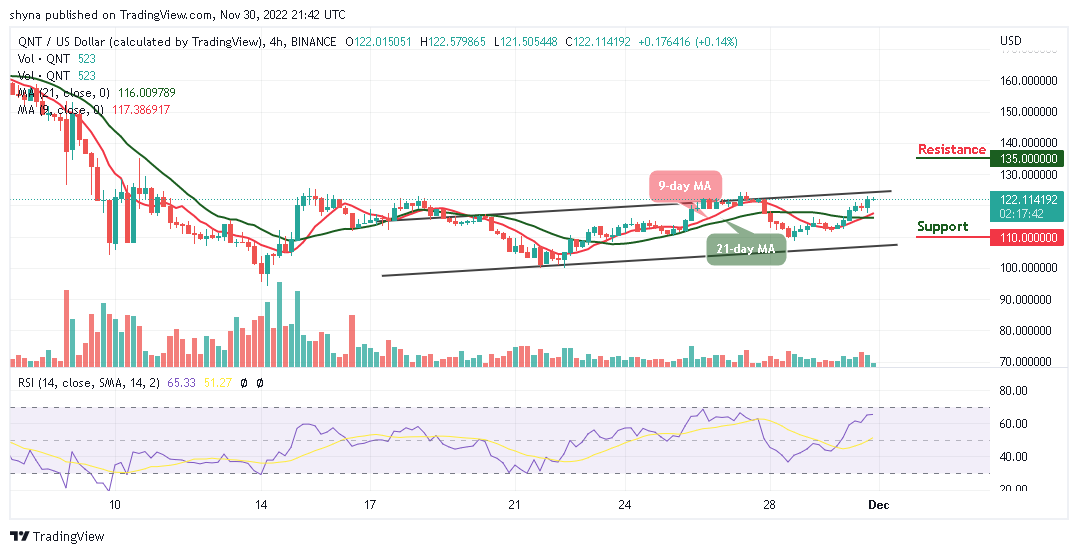
In other words, if the bears try to break down the price, traders would expect the market to touch the support level of $110 and below. Meanwhile, a bullish continuation would push the price to the resistance level of $135 and above as the technical indicator Relative Strength Index (14) moves to cross into the overbought region.
Place winning Quant trades with us. Get QNT here