Official Trump (TRUMP/USDT) Seeks to Settle Above Support Levels Amidst Volatility
Estimated Reading Time: 3 minutes
Don’t invest unless you’re prepared to lose all the money you invest. This is a high-risk investment and you are unlikely to be protected if something goes wrong. Take 2 minutes to learn more

After what seems to be a sharp dip in price earlier this year, Official Trump against Tether appears to be moving within a confined space in the last 24 hours. However, the pair seems to be recovering, facing the $5.00 resistance as the pair records a modest gain of 0.4%.
As it stands, the price is still operating below indicators like the Guppy Multiple Moving Averages (GMMA), though the Stochastic RSI signals improving momentum. However, conditions for a prolonged upside move are yet to be met.
Currently, Official Trump trades at $4.812 with more than 1.33 million volumes for the day.
Technical Indicators
Major Resistance Levels: $4.864, $4920, and $5,033
Major Support Levels: $4.780, $4.700, and $4.620
Technical Analysis
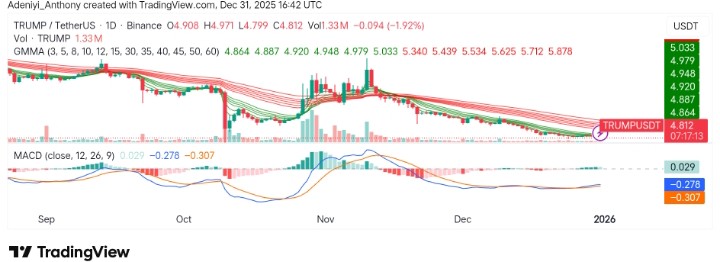
On the daily chart, Official Trump appears to be showing a slight upward movement, with a gradual recovery from lower levels. As it stands, analysts have observed that the price has recently been bouncing off a key support zone, suggesting the possibility of a more sustained bullish move if the upward momentum continues.
To this end, the GMMA is yet to confirm a bullish breakout, but if momentum can sustain above $5.000, a move towards $6.000 is the next, as the MACD displays bullish momentum.
Official Trump’s Update
After hitting $6.80 some weeks ago, Official Trump appears to be sliding again, reaching $5.86 in recent times. Though the token was expected to improve above $5.96 or higher the following day, but the token seems to be affected by large insider sales as the broader trend shows weakness.
To this end, analysts are of the opinion that the token could see a modest recovery soon, which may be followed by a sharp downturn.
TRUMP/USDT Analysis: Operating on a Spot: What’s Next?
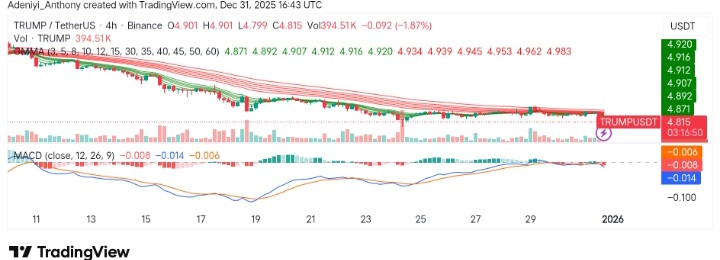
On the 4-hour chart, TRUMP/USDT seems to have encountered resistance around $4.900.
As it stands, the GMMA on the 4-hour chart shows a flattening of the shorter-term averages, suggesting indecision. However, the MACD shows a slight decline, and the histogram appears to be printing negative values. This indicates a potential bearish correction in the coming session.
To this end, if the price fails to break through the $4.836-$4.920 resistance, we could see a downward move toward $4.800.
You can purchase crypto coins here. Buy Crypto