Polygon (MATIC/USD) Price Is Hovering and Establishing a Base at $1
Estimated Reading Time: 3 minutes
Don’t invest unless you’re prepared to lose all the money you invest. This is a high-risk investment and you are unlikely to be protected if something goes wrong. Take 2 minutes to learn more
Polygon Price Prediction – April 30
The Polygon (MATIC/USD) price is hovering and establishing a base at $1, possessing high and low trading value lines between $1.004 and $0.991. There is a sign of minute negativities rated at 0.40, leaving every chance to indecision trading condition. So, before rejoining the pairing trade operation, the two market movers needed to exercise caution.
MATIC/USD Market
Key Levels
Resistance levels: $1.10, $1.20, $1.30
Support levels: $0.90, $0.80, $0.70
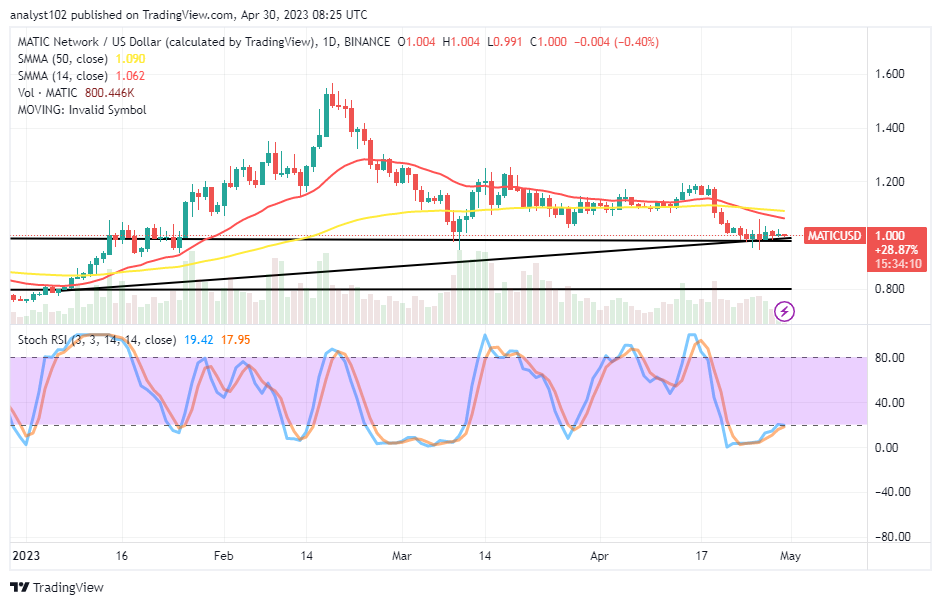
MATIC/USD – Daily Chart
It mirrored on the MATIC/USD daily chart that the crypto-economic price is hovering and establishing a base at $1 beneath the trend lines of the SMAs. The 14-day SMA indicator has slightly intercepted the 50-day SMA indicator to the south side, producing trading points of $1.090 to $1.062. The Stochastic Oscillators have dipped in the oversold region to move tightly over the zero level before conjoining their lines in a northbound-moving mode to 17.95 and 19.42.
Could there be other declining phases beyond the $1 baseline of the MATIC/USD market?
Sellers’ gravitational force to the downside at $1 appears not to gain much-required weight to make up with safe lows as the MATIC/USD business is hovering and establishing a base around the point. In the myth of trying to regain some lost momentum, long-position takers should get back into a buying spree with a low-leverage figure to avoid an unnecessary moment of possibly jumping into the market while a volatile motion plays out.
On the devaluation-moving direction of the technical analysis of the MATIC/USD market operations, a less outcome will obtain even if the American currency tempts, dominating the pushing pace around the baseline of $1. Emphatically, it is not technically ideal to follow a further drop below the value line, going by the formation of variant candlesticks, indicating a pivotal mode alongside the trending pattern of the Stochastic Oscillators.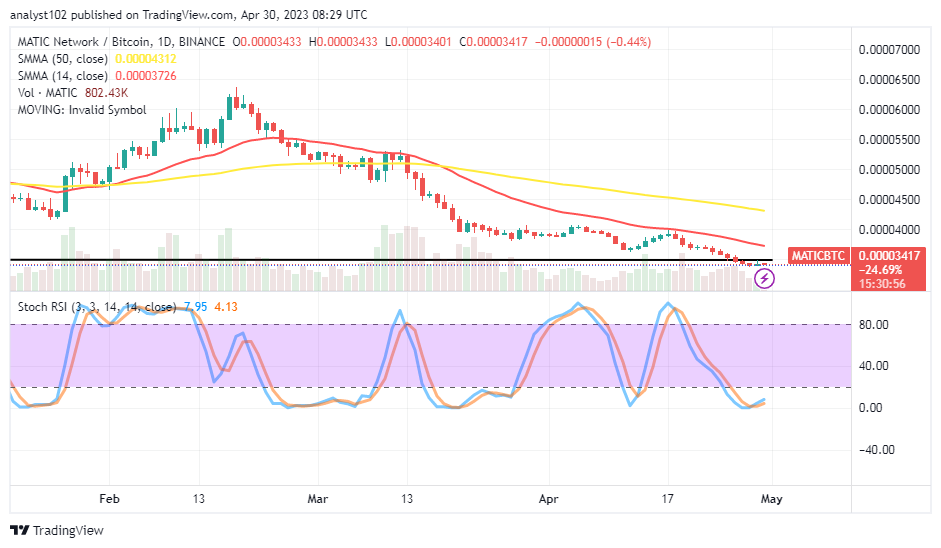
MATIC/BTC Price Analysis
In contrast, Polygon has continually been holding tightly to the south side of the horizontal line drawn by the trending force of Bitcoin. The price analysis chart showcases the pairing cryptocurrency trade is hovering and establishing a base beneath the SMA trend lines. The Stochastic Oscillators are in the oversold region, feebly in a northbound-crossing mode from 4.13 to 7.95 levels. Therefore, the base crypto needs to force a formation of a bullish trading candlestick any time from now to affirm the resumption of outpacing the strength of the counter-trading instrument.
Note: Cryptosignals.org is not a financial advisor. Do your research before investing your funds in any financial asset or presented product or event. We are not responsible for your investing results.
You can purchase Lucky Block here. Buy LBLOCK