Polygon (MATIC/USD) Market Makes a Correction to $1
Estimated Reading Time: 3 minutes
Don’t invest unless you’re prepared to lose all the money you invest. This is a high-risk investment and you are unlikely to be protected if something goes wrong. Take 2 minutes to learn more
Polygon Price Prediction – April 16
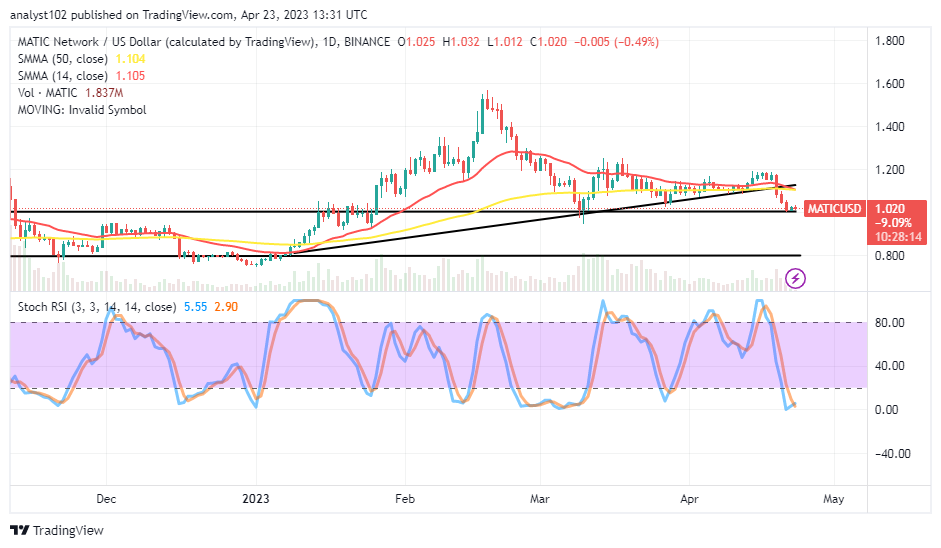
MATIC/USD market operations witnessed a correction downward from a high point of around $1.20, recording the second time after it lost momentum from a bigger spot beneath the $1.60 resistance. As this piece was being written, the price is around $1.020 at a relatively negative percentage rate of 0.49. Presently, the downsizing movement appears to be accomplishing its course shortly.
MATIC/USD Market
Key Levels
Resistance levels: $1.10, $1.20, $1.30
Support levels: $0.90, $0.85, $0.80
MATIC/USD – Daily Chart
The MATIC/USD daily chart pictures the crypto-economic market making a correction to the $1 support trading spot, serving as the previous upper range axis. The 14-day SMA trend line is at $1.105 with a tinier-up distance to the $1.104 value line of the 50-day trend line. The Stochastic Oscillators have shown a complete length of dipping in the oversold area, maintaining levels of 2.90 and 5.55, suggesting a propensity for an upward swing to reappear shortly.
Will the MATIC/USD market at the $1 spot continue to lose momentum?
Further low-key trading actions from the part of the MATIC/USD trader sellers could surface around $1 to let the situation change to a rallying motion as the crypto corrects the point presently. There may be a pause-trading session around the zone before buyers strive to reclaim their stances. Based on that psychological projection, a bullish-trading candlestick will have to exhume from a lower spot to affirm the need to count on the subsequent up swings.
On the downside of the technical analysis, it might not be safe for short-position takers to continue with their shorting traits below the point of $1 because the trading velocity to deepen such a decline underneath the line isn’t weighty enough going by reading from a thinking angle at this moment. Instead, bears might take over by embarking on a consolidation trend that could put the cryptocurrency market at risk of returning to its lower range-bound positions of $1 and $0.80 if bulls or buyers fail to recover on time.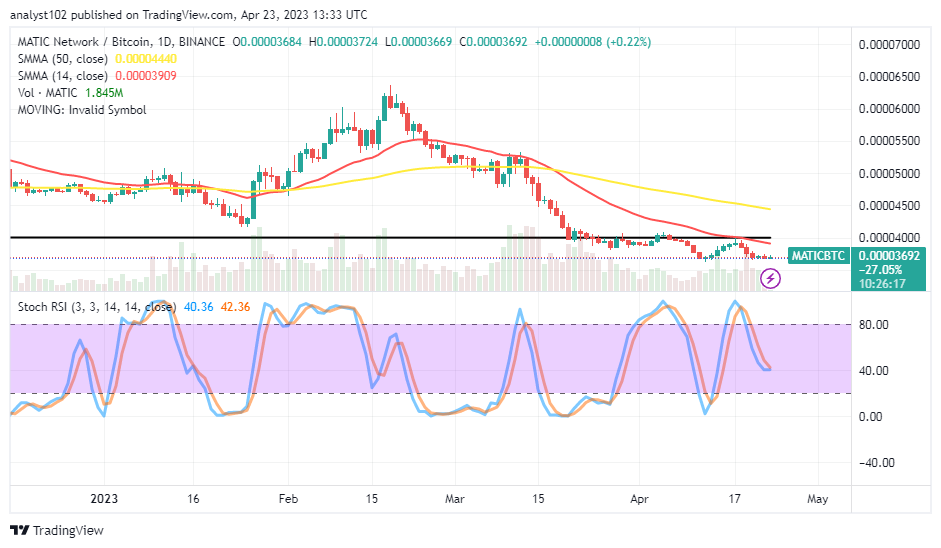
MATIC/BTC Price Analysis
In contrast, Polygon is still wallowing under a pressure-trading set up against Bitcoin below the smaller SMA trend line. There is also a sign of correction to a lower spot between the duo cryptocurrency market. The 14-day SMA indicator is underneath the 50-day SMA indicator. The Stochastic Oscillators have moved southbound from the overbought region to the level of 40. And they are around 40.36 and 42.36, trying to close. That suggests that counter crypto is gradually reducing its prevalence against the base instrument soon.
Note: Cryptosignals.org is not a financial advisor. Do your research before investing your funds in any financial asset or presented product or event. We are not responsible for your investing results.
You can purchase Lucky Block here. Buy LBLOCK


