Polygon (MATIC/USD) Price Is Attempting to Retrace
Estimated Reading Time: 3 minutes
Don’t invest unless you’re prepared to lose all the money you invest. This is a high-risk investment and you are unlikely to be protected if something goes wrong. Take 2 minutes to learn more
Polygon Price Prediction – April 16
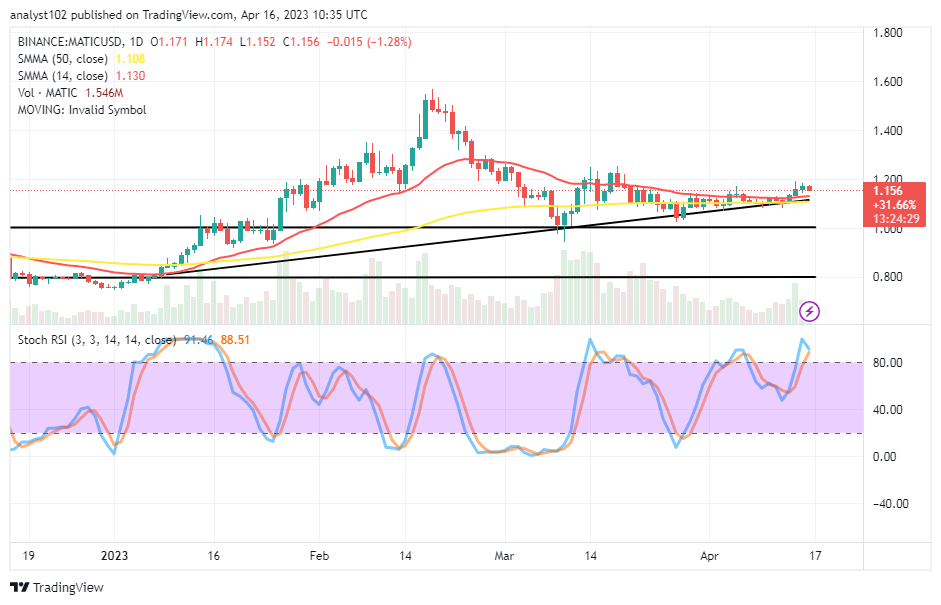
The MATIC/USD price attempts to retrace from a resistance zone close to $1.20 after satisfying some up-trending motions in recent past operations. A negative percentage rate of 1.28 has occurred, giving the weight pace the US Dollar has been able to push against the cryptocurrency. The last several trading hours demonstrate that purchasers must retreat to counteract the falling movement past the $1.174 high.
MATIC/USD Market
Key Levels
Resistance levels: $1.25, $1.35, $1.45
Support levels: $1.05, $0.95, $0.85
MATIC/USD – Daily Chart
The MATIC/USD daily chart showcases the crypto-economic price is attempting to retrace after seemingly being seen to have exhausted forces in its approach toward the resistance of $1.20. The 14-day SMA indicator is at a $1.130 value line above the 50-day SMA indicator, which is at a $1.108 value. The Stochastic Oscillators are in the overbought region, trying to cross their lines at 91.46 and 88.51 levels to the southbound. It implies that time is gradually ripening against getting to see a continuation of uprisings in the valuation of Polygon.
What trading strategy should the MATIC/USD market traders practice right now?
Instant execution of a shorting order ought to have been alongside the current-slight force to the downside, and a protective stop loss order would have to be around the $1.25 resistance as the MATIC/USD price attempts to retrace. Long-position placers to be away and realign themselves at the lower trading end. And that can happen after receiving a signal indicating that the motion to the endpoint has been exhausted before placing a purchase order. Particularly on the daily time chart, it is evident that the trending force in this industry has been relatively weak. And it makes it necessary to exercise prudence at all times.
On the downside of the technical analysis, there can be room for the dominance of bears in the MATIC/USD market over the bulls in the following activities, provided the resistance level at $1.20 remains unbroken to the upside. However, the moves to the reduction side needed to breach $1.10 support forcibly to produce further lows in the subsequent sessions. In the long run, with that bearish-projected trade plan, the support line of $1 will be harder for the price to devalue past.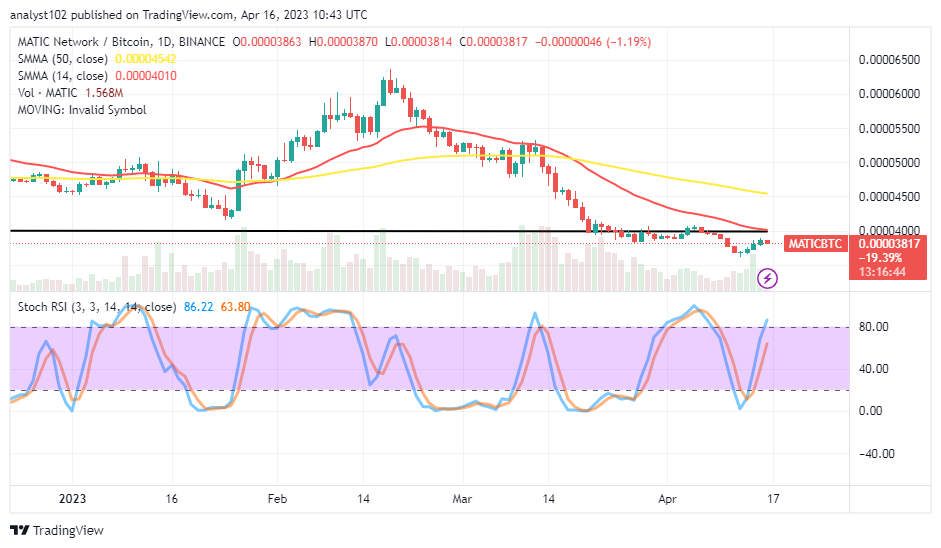
MATIC/BTC Price Analysis
In contrast, the Polygon market is attempting to retrace some points gained against Bitcoin’s trending force, having struggled to push near the trend line of the smaller SMA from a lower-trading spot. The 14-day SMA indicator is beneath the 50-day SMA indicator. The horizontal line drew eastwardly to mark down the zone the former trading instrument may debase for a while. The Stochastic Oscillators have traversed northbound from the oversold region to 63.80 and 86.22 levels, positioning in a manner of tending to close shortly. That signifies the need to take a precautionary trading approach against the execution of buying orders for a while.
Note: Cryptosignals.org is not a financial advisor. Do your research before investing your funds in any financial asset or presented product or event. We are not responsible for your investing results.
You can purchase Lucky Block here. Buy LBLOCK