Avalanche (AVAX/USD) Targets $22.9, Aiming to Surpass the High of February 2nd
Estimated Reading Time: 2 minutes
Don’t invest unless you’re prepared to lose all the money you invest. This is a high-risk investment and you are unlikely to be protected if something goes wrong. Take 2 minutes to learn more
In early February, Avalanche experienced a peak of $22.9 before the onset of the bear market. The subsequent decline in price was gradual, attributed to the prevalent bullish sentiment amidst the bearish market conditions.
Despite the persistence of bulls achieving lower highs, the $10.60 price level, which served as the starting point in January and a crucial support level, came under pressure and succumbed to the bearish momentum in August. The breach of this price level prompted many traders to enter the bull market, although substantial selling pressure persisted.
Avalanche Market Data
- AVAX/USD Price Now: $20.18
- AVAX/USD Market Cap: $7,171,069,454
- AVAX/USD Circulating Supply: 355,453,034 AVAX
- AVAX/USD Total Supply: 432,829,621 AVAX
- AVAX/USD CoinMarketCap Ranking: #14
Key Levels
- Resistance: $20.00, $25.00, and $30.00.
- Support: $13.50, $13.00, and $12.50.
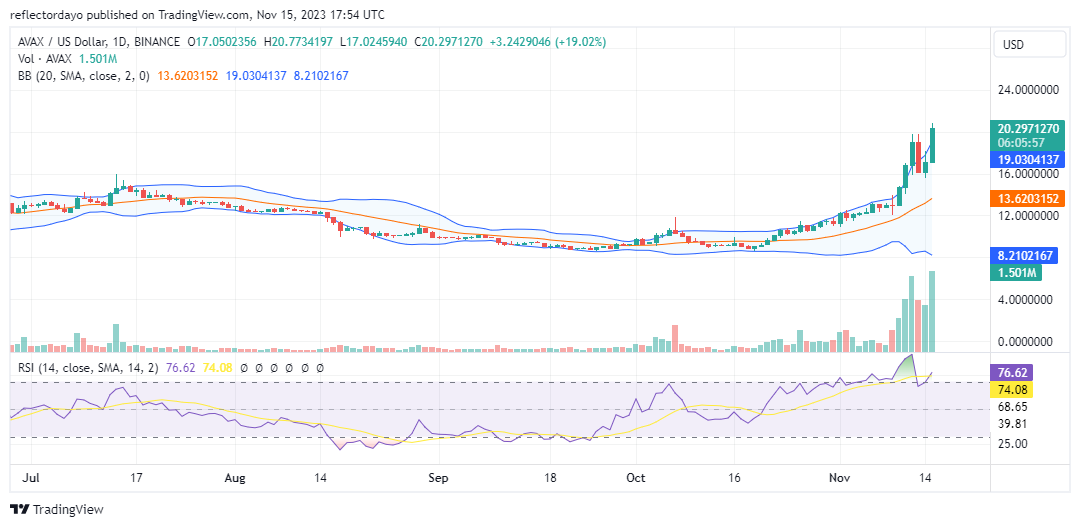
The Avalanche Price Forecast: Analyzing the Indicators
The Avalanche market underwent a nearly two-month consolidation period below the pivotal $10.6 price level, which marked the starting point on January 1 for Avalanche this year. Towards the conclusion of October, the market exhibited a surge in momentum accompanied by an increase in volatility, propelling the price on an upward trajectory.
However, the Bollinger Bands exhibited divergence, with the upper standard deviation indicating a bullish dominance in the market. Simultaneously, the downward trend of the lower standard deviation curve signaled the formidable presence of bears. Furthermore, the Relative Strength Index (RSI) highlighted an overbought condition in the market, suggesting potential resistance above the $20.00 price level.
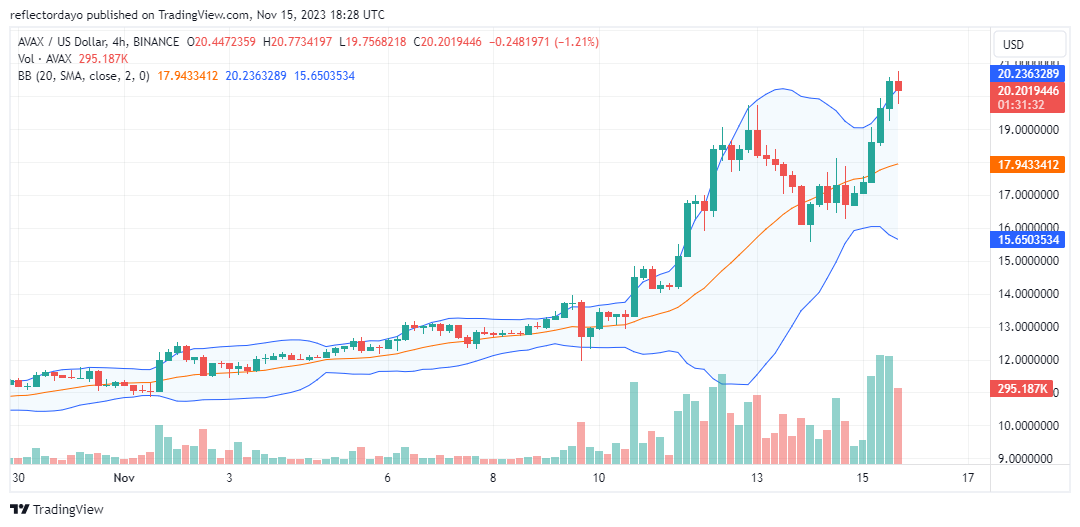
AVAX/USD 4-Hour Chart Outlook
The 4-hour chart signals potential resistance above the $20.00 price level. Although the price initially surpassed this resistance, the current candlestick on the 4-hour chart reflects significant indecision in the market. There is a possibility, however, that the bulls may establish the $20.00 price level as a new higher support, sustaining the momentum of the bullish market.