Polygon (MATIC/USD): Bull Market Approaches the $1.00 Price Mark
Estimated Reading Time: 3 minutes
Don’t invest unless you’re prepared to lose all the money you invest. This is a high-risk investment and you are unlikely to be protected if something goes wrong. Take 2 minutes to learn more
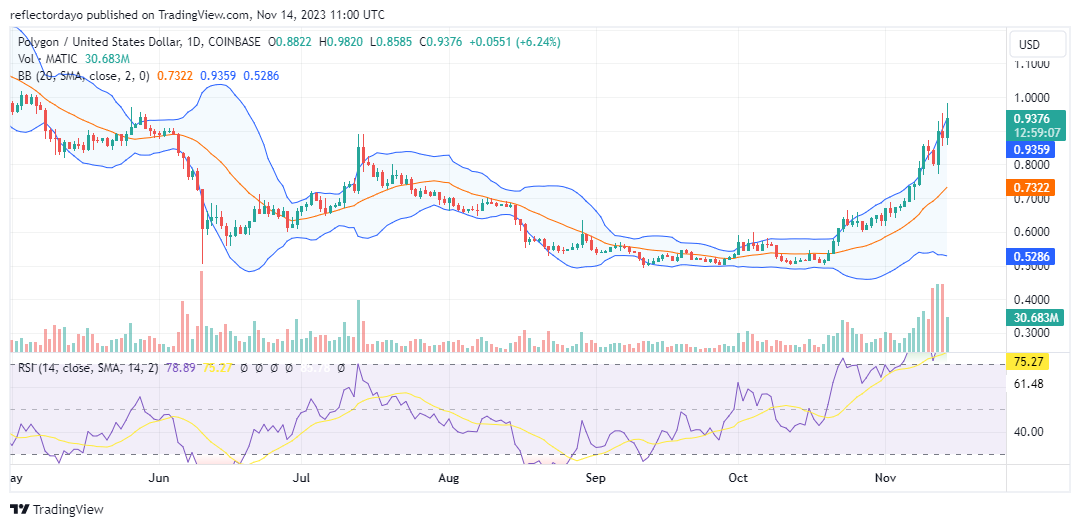
After reaching the $1.600 price level in late February, Polygon experienced a gradual decline, extending from that point to the latter part of October. Upon reaching the $5.00 price level during the bear market, further downward movement was halted as traders demonstrated readiness to buy at this level. Consequently, the market reversed direction to the upside and has since maintained an upward trend as bullish sentiment gained momentum. The observed market behavior along this trajectory indicates a strengthening bullish momentum.
Polygon Market Data
- MATIC/USD Price Now: $0.924
- MATIC/USD Market Cap: $8,491,480,428
- MATIC/USD Circulating Supply: 9,250,438,354 MATIC
- MATIC/USD Total Supply: 10,000,000,000 MATIC
- MATIC/USD CoinMarketCap Ranking: #11
Key Levels
- Resistance: $1.00, $1.50, and $2.00.
- Support: $0.750, $0.700, and $0.65.
The Polygon Price Forecast: Analyzing the Indicators
As the Polygon bull market progresses, there is a notable increase in bullish momentum. This surge in momentum is evident in the ease with which the price has surpassed several major resistance levels. However, as the market, which initiated its trend from the $5.00 price level, breaks beyond the $8.00 price level, heightened volatility ensues, triggered by a resurgence of bearish traders. This has led to a divergence in the lower standard deviation of the Bollinger Bands.
Furthermore, as the market approaches the $1.00 price level, there is a heightened level of volatility. This suggests that the $1.00 price level may pose a formidable resistance level. Adding to the concerns for bullish traders is the diminishing trade volume, indicating that the market may be preparing for either a consolidation or a retracement upon reaching the critical $1.00 price level.
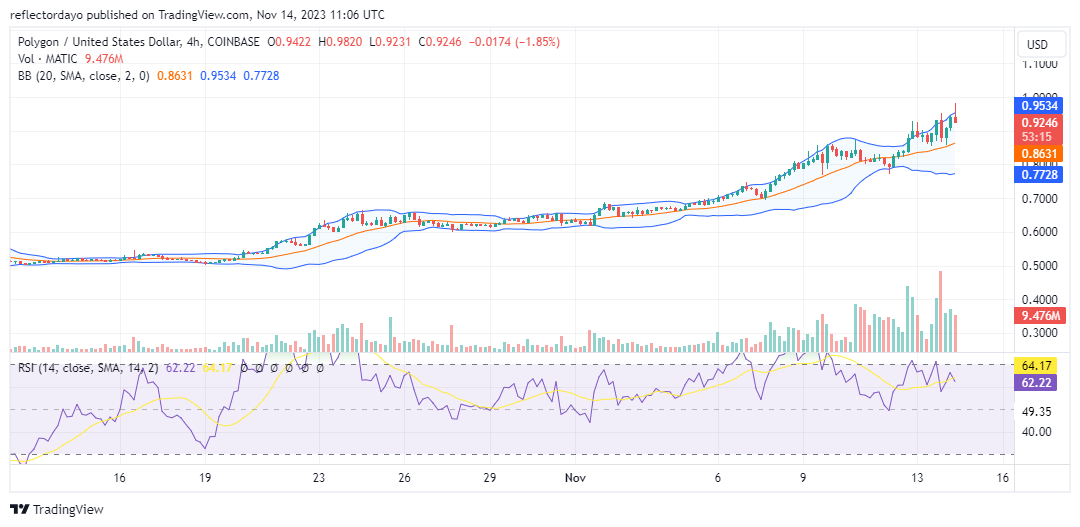
MATIC/USD 4-Hour Chart Outlook
The candlestick pattern observed in the most recent 4-hour session indicates a potential reversal, specifically identified as an inverted hammer candlestick. This formation implies a concentration of robust sell orders around the $1.00 price level, acting as a significant barrier to the ongoing bull market at this threshold. Nevertheless, should Polygon manage to sustain its current bullish sentiment, achieving equilibrium between demand and supply, there is a possibility of market consolidation around this level.