Ethereum (ETH) Continues a Downward Move, May Find Support above $2,340
Estimated Reading Time: 2 minutes
Don’t invest unless you’re prepared to lose all the money you invest. This is a high-risk investment and you are unlikely to be protected if something goes wrong. Take 2 minutes to learn more

Ethereum Price Long-Term Analysis: Bullish
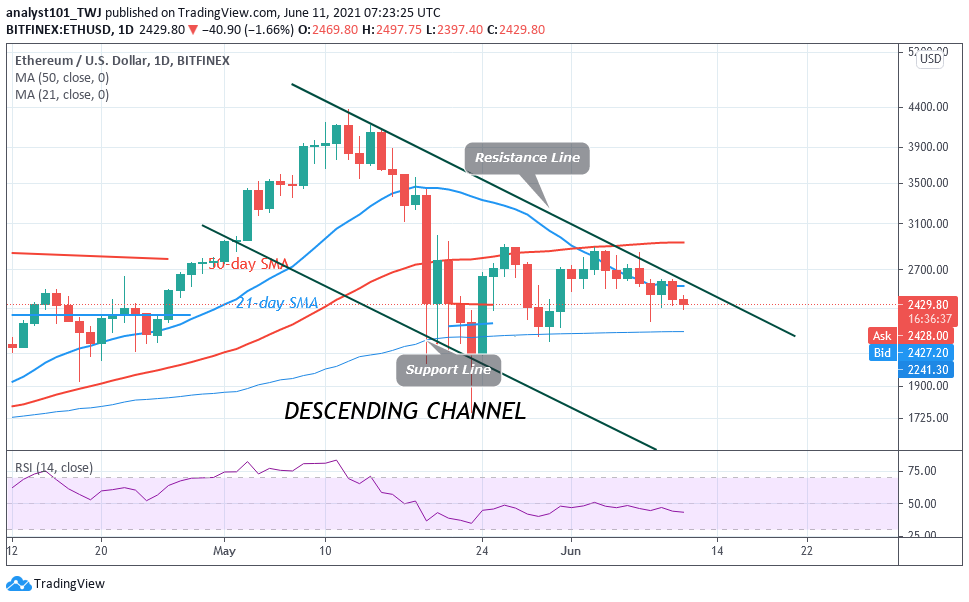
Following the second rejection at the $2,900 resistance, Ethereum has fallen to $2,448.20 low. In the previous rejection, the market declined to $2,206.70 before the upward move. Ether price has broken below the moving averages as a further downside is expected. The biggest altcoin is approaching the oversold region of the market where buyers are likely emerging.
Ethereum Indicator Analysis
Ethereum has fallen to level 43 of the Relative Strength Index period 14. It indicates that Ether is in the downtrend zone and capable of falling on the downside. The 21-day and 50-day SMAs are sloping downward indicating the downtrend. The biggest altcoin is below the 25% range of the daily stochastic. It indicates that the market has reached the oversold region of the market. Buyers are likely to emerge in the oversold region of the market.

Technical indicators:
Major Resistance Levels – $2, 600, $2,800, $3,000
Major Support Levels – $1.500, $1, 300, $1,100
What Is the Next Direction for Ethereum?
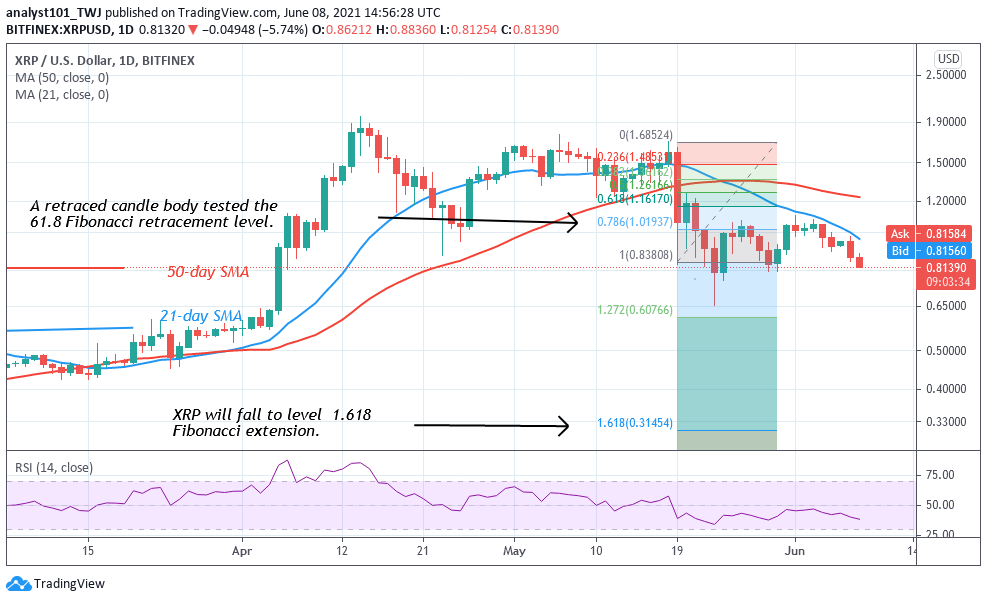
The biggest altcoin has fallen and approached the oversold region. Meanwhile, on June 8 uptrend; a retraced candle body tested the 78.6% Fibonacci retracement level. The retracement indicates that ETH is likely to fall and reverse at level 1.272 Fibonacci extension or $2,315.30..

Note: new.cryptosignals.org is not a financial advisor. Do your research before investing your funds in any financial asset or presented product or event. We are not responsible for your investing result