Ripple (XRP) Is Falling, Targets Level $0.314
Estimated Reading Time: 2 minutes
Don’t invest unless you’re prepared to lose all the money you invest. This is a high-risk investment and you are unlikely to be protected if something goes wrong. Take 2 minutes to learn more

Ripple (XRP) Long-Term Analysis: Bullish
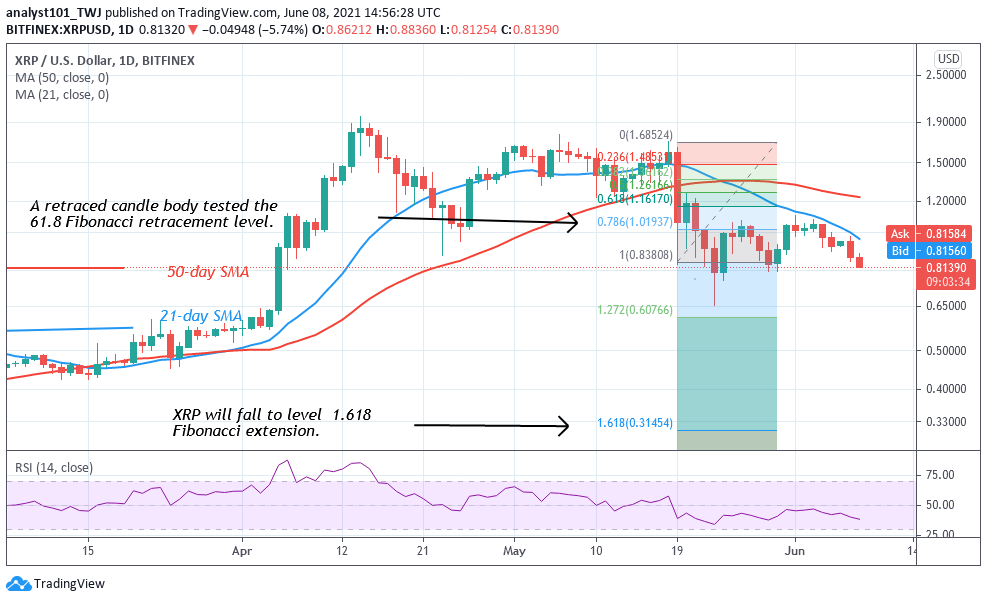
For the past week, Ripple has been in a downward move. XRP fell after several unsuccessful attempts to break the resistance at level $1.05. Presently, XRP has fallen above $0.83 support. On the downside, if price breaks below the current support, XRP is likely to further decline to $0.80 support level. When the support at $0.80 cracks, the market will further decline to $0.66 low. Meanwhile, Ripple is still trading above the $0.83 support. If the support at $0.83 holds, XRP will resume an upward move. Buyers will attempt to push the crypto back above $1.10 high. Meanwhile, on May 19 downtrend; a retraced candle body tested the 61.8% Fibonacci retracement level. The retracement indicates that Ripple is likely to fall to level 1.618 Fibonacci extension or level $0.314
Ripple (XRP) Indicator Analysis
Ripple price is below the SMAs which suggests further downsides. The crypto is at level 39 of the Relative Strength Index period 14. It indicates that the market is in the downtrend zone and below the centerline 50. Ripple is below the 20% range of the daily stochastic. It indicates that the XRP price has fallen into the bearish trend zone.

Technical indicators:
Major Resistance Levels – $2.00, $2.50, $3.00
Major Support Levels – $1.50, $1.00, $0.50
What Is the Next Direction for Ripple (XRP)?
Ripple is in a downward move. On the 4 Hour Chart, Ripple is falling. Meanwhile, on June 4 downtrend; a retraced candle body tested the 61.8% Fibonacci retracement level. The retracement indicates that Ripple is likely to fall to level 1.618 Fibonacci extension or level $0.81. The price action has surpassed that level.

Note: new.cryptosignals.org is not a financial advisor. Do your research before investing your funds in any financial asset or presented product or event. We are not responsible for your investing results