Bitcoin (BTC/USD) Market Moons Higher, Hitting $45,000
Estimated Reading Time: 3 minutes
Don’t invest unless you’re prepared to lose all the money you invest. This is a high-risk investment and you are unlikely to be protected if something goes wrong. Take 2 minutes to learn more

Free Crypto Signals Channel
Bitcoin Price Prediction – March 2
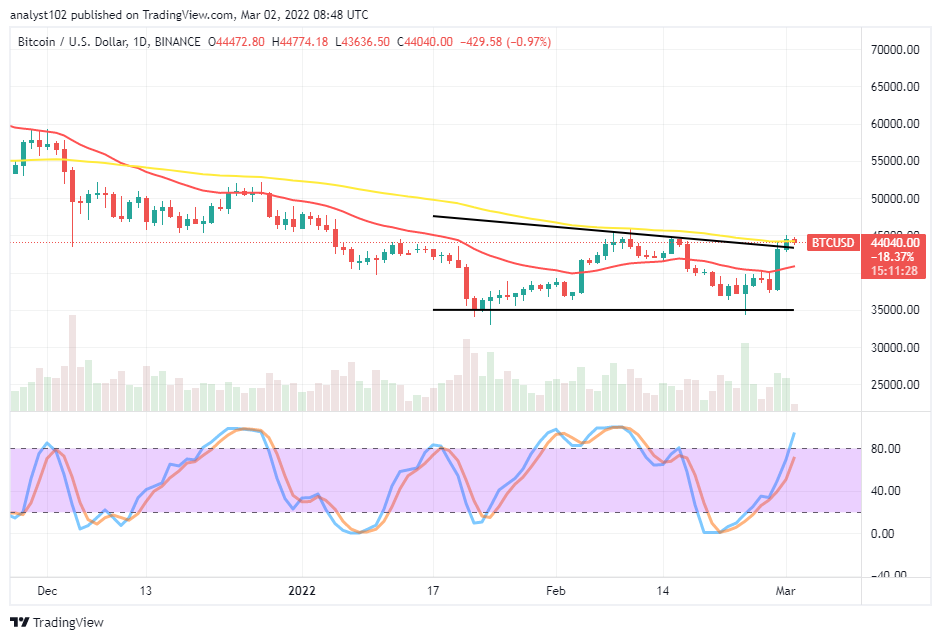
There have been ups returning in the BTC/USD trading activities as the crypto-economic market moons higher to hit resistance around the $45,000 line. Specifically, taking the recording of the high and low-value lines within which price has been pushing, we now have $44,774 and $43,636 with a minute negative percentage of 0.97.
BTC/USD Market
Key Levels:
Resistance levels: $45,000, $47,500, $50,000
Support levels: $42,500, $40,000, $37,500
BTC/USD – Daily Chart
The BTC/USD daily chart reveals the crypto-economic market moons higher, hitting a $45,000 resistance trading level. The resistance value-line would play a crucial role in determining the subsequent price direction having that situation now as the bearish trend line drew and the bigger SMA are around the point a bit lower. The 14-day SMA indicator is underneath the 50-day SMA indicator. The Stochastic Oscillators have slightly penetrated the overbought region. Yet, they portend that upward pressure is holding for a while.
Will the BTC/USD prices lower in the near time as the crypto-economic market moons higher, hitting $45,000?
Because the crypto economies are still in the bearish trading cycle, the hike in the BTC/USD trade operations could be another chance for the price to begin to lose momentum as the market moons higher to hit $45,000 resistance. The market holds the rebounding motion past the point in question. The more-higher critical resistance point of the cycle lies at the $50,000 resistance level.
On the downside of the technical analysis, a bearish engulfing candlestick will have to emerge around the $45,000 resistance level to affirm a return of a falling force in the market. However, the slight appearance of the Stochastic Oscillators in the overbought region suggests that some spikes may still surface to let there be a consolidation movement, possibly afterward. Expectantly, at a later time, when the market tends to lose energy to push northward more, then there will be decent room for shorting orders.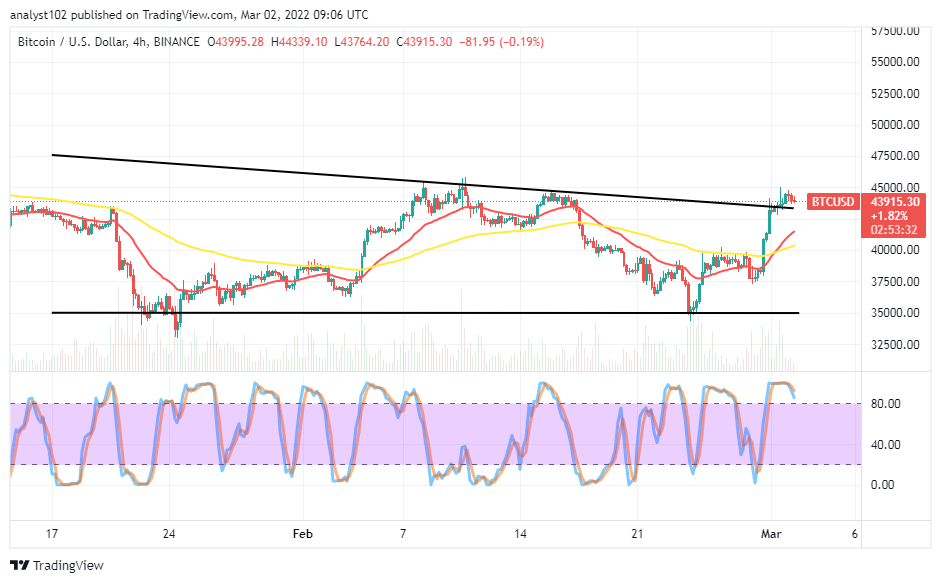
BTC/USD 4-hour Chart
The BTC/USD 4-hour chart shows the crypto-economic market moons higher, hitting a $45,000 resistance level after a successive rebounding motion. The 14-day SMA indicator has intercepted the 50-day SMA indicator from beneath. The bearish trend line has briefly breached northward. The Stochastic Oscillators are in the overbought region, signifying the potentiality of seeing the crypto economy losing back some of its valuations to the downside. The higher resistance trading line to the value line mentioned earlier in the medium-term trading outlook is $47,500. Therefore, exerting long orders at this point isn’t psychological augur well.
Note: Cryptosignals.org is not a financial advisor. Do your research before investing your funds in any financial asset or presented product or event. We are not responsible for your investing results.
You can purchase Lucky Block here. Buy LBlock: