Official Trump (TRUMP/USDT) Struggles with Downward Momentum
Estimated Reading Time: 3 minutes
Don’t invest unless you’re prepared to lose all the money you invest. This is a high-risk investment and you are unlikely to be protected if something goes wrong. Take 2 minutes to learn more

In the last 24 hours, the official Trump against Tether has fallen by 2.08%, performing worse than the overall crypto market’s decline of 0.86%. Analysts are of the opinion that the key reason for this drop is the release of a large amount of TRUMP tokens, worth $24.8 million, into the market. In addition to this, the price has failed to hold above the $6.30 resistance level and is now approaching a crucial support range between $4.70 and $5.00, signaling further potential losses.
From another perspective, this decline also appears to be caused by political factors.
As a result, speculative demand for TRUMP has faded, contributing to its underperformance in the market.
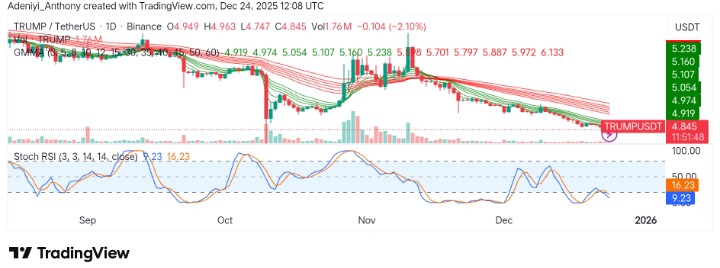
Currently, Official Trump trades at $4.845 with more than 1.76 million volumes for the day.
Technical Indicators
Major Resistance Levels: $5.108, $5.160, and $5.238
Major Support Levels: $4.822, $4.747, and $4.500
Technical Analysis
Technically, Official Trump against Tether trends downward on the daily timeframe. This is evident as the Guppy Multiple Moving Averages (GMMA) shows a bearish configuration, signaling massive bearish dominance as the price heads further into the $4.00 zone.
However, the signal from the Stochastic RSI shows that the pair is extremely oversold, and a bounce from this level might surface, provided the $4.822 support holds strong even as the lines extend and move into the 10-mark level.
To this end, though it is unclear which direction the price will break, $4.822 is the level to watch.
$TRUMP 🔻
Trend is deeply pressured, but RSI div + oversold StochRSI hint a possible bounce.
Key support to defend: 4.90–4.92 (BB low).
Lose that and 4.50–4.60 opens.
First reclaim levels: 5.05 → 5.20 for any real reversal attempt. pic.twitter.com/vNWjLkQ3uy
— DYOR.net – Crypto Market Scanner (@DyorNetCrypto) December 23, 2025
Meanwhile, @DYORnetCrypto discussed the current trend for the Official TRUMP some hours ago, highlighting the significance of technical indicators. The analyst signals the market is under pressure but points out the potential for a bounce, as suggested by the RSI divergence and oversold StochRSI. To this end, it was highlighted that key support levels to watch are between $4.90 and $4.92, with a breakdown below these levels potentially opening the way for a decline to $4.50–$4.60.
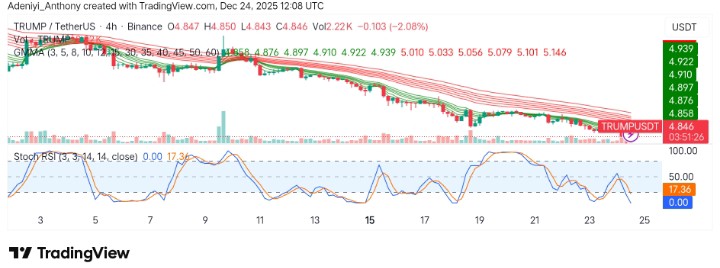
TRUMP/USDT Analysis: Struggling to Rebound
On the 4-hour chart, TRUMP/USDT is reflecting a downtrend as both the GMMA and the Stochastic RSI display bearish dominance. From the upper section of the chart, the sets of EMAs appear to be trending towards the southeast as the price operates underneath the short-period EMAs.
However, a look at the operation of the momentum oscillator shows that bearish pressure may extend further for a short moment, but an impending bounce towards $5.00 may be looming.
You can purchase crypto coins here. Buy Crypto