Chainlink Revisits Its Previous Low as It Faces Rejection at $7.60
Estimated Reading Time: 2 minutes
Don’t invest unless you’re prepared to lose all the money you invest. This is a high-risk investment and you are unlikely to be protected if something goes wrong. Take 2 minutes to learn more

Free Crypto Signals Channel
Chainlink (LINK) Long-Term Analysis: Ranging
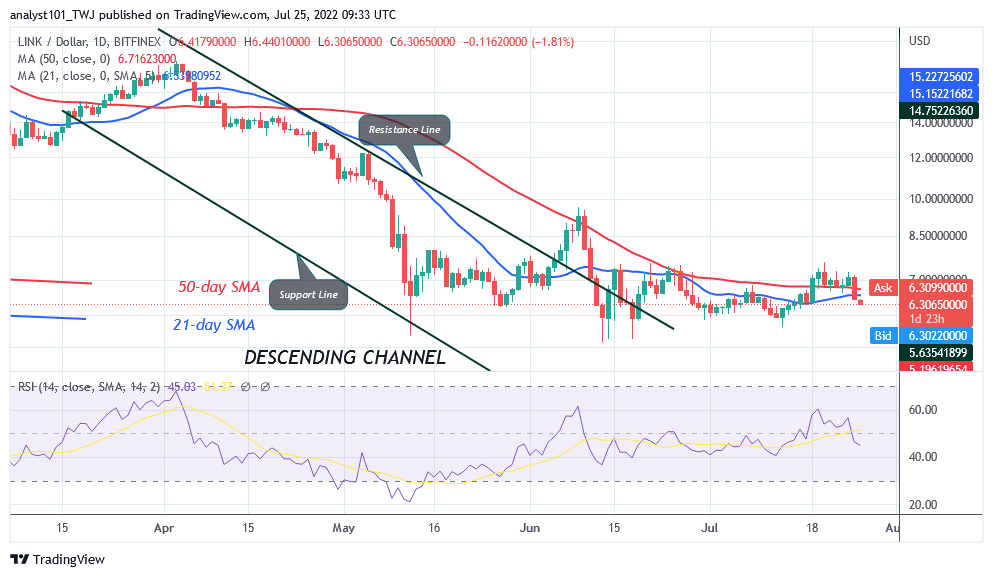
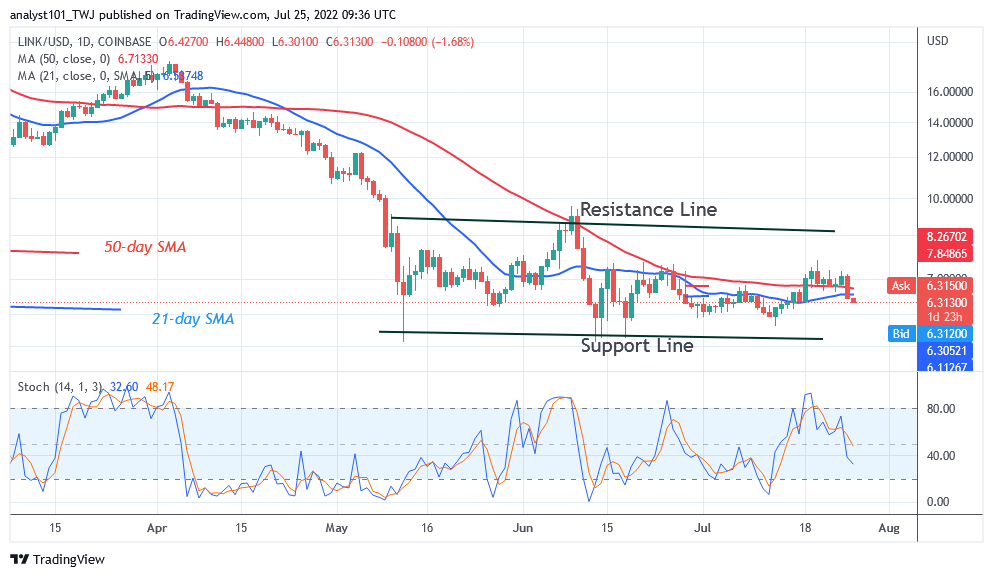
Chainlink’s (LINK) price has broken below the moving average lines as it faces rejection at $7.60. It has declined to the low of $6.32 and it is approaching the low of $5.70 price level. Since June 16, the market has been in a range-bound move. The price action is characterized by small body indecisive candlesticks called Doji. These Doji candlesticks are responsible for the marginal price movement. The candlesticks indicate that buyers and sellers are undecided about the direction of the market.
Chainlink (LINK) Indicator Analysis
The altcoin is at level 45 of the Relative Strength Index for period 14. It indicates that the altcoin is in the downtrend zone as price breaks below the moving average lines. The cryptocurrency is declining to the precious low of $5.40 . The price bars are below the moving average lines indicating a price decline. LINK is below the 40% area of the daily stochastic. The market is in a bearish momentum.
Technical indicators:
Major Resistance Levels – $18.00, $20.00, $22.00
Major Support Levels – $8.00, $6.00, $4.00
What Is the Next Direction for Chainlink (LINK)?
LINK/USD has continued its range-bound move as it faces rejection at $7.60. Chainlink will trend when it rebounds above the moving lines. Presently, it is declining to the lower price range. Buyers have defended the current support since May 12. The long candlestick tail indicates that there is strong buying pressure at lower levels of price.
You can purchase crypto coins here. Buy LBlock
Note: Cryptosignals.org is not a financial advisor. Do your research before investing your funds in any financial asset or presented product or event. We are not responsible for your investing results