Bitcoin Cash (BCH/USD) Price Trades Sideways
Estimated Reading Time: 3 minutes
Don’t invest unless you’re prepared to lose all the money you invest. This is a high-risk investment and you are unlikely to be protected if something goes wrong. Take 2 minutes to learn more
Bitcoin Cash Price Prediction – August 6
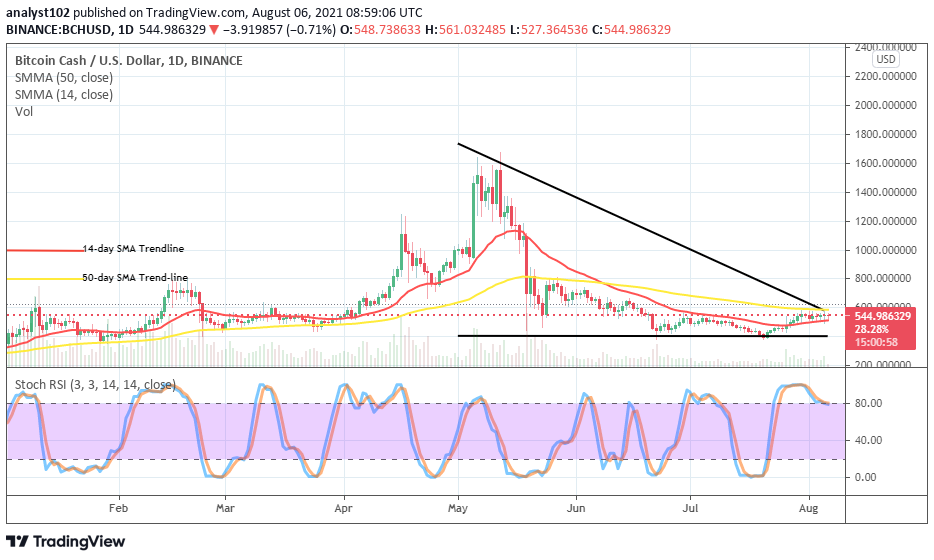
The BCH/USD price trades sideways within the range-bound trading zones of $400 and $600. The percentage rate of the crypto market sees a negative of aroun0.71, trading around the level of $544.
BCH/USD Market
Key Levels:
Resistance levels: $600, $800, $1,000
Support levels: $400, $300, $200
BCH/USD – Daily Chart
The BCH/USD daily trading chart showcases that the crypto’s price trades sideways within well-defined range-bound values. The 50-day SMA indicator is around the upper orange line above the 14-day SMA indicator. And, the bearish trend-line drew downward to touch the bigger SMA on the buy signal side where the immediate resistance value is. The Stochastic Oscillators have crossed the lines in the overbought region, seemingly struggling to cross back the lines to the northbound.
Would there still be a continuation of price trades sideways in the BCH/USD market operation?
A continuation of price trades sideways within range-bound zones of $400 and $600 lines may still witness as long as the two major market movers do not deem it fit to re-energize their presence in the market. It is more challenging to bulls as the sideways movement has kept close to the upper range line, lacking the capacity to push northward further. The market is in a complete recessive trading situation as confined in the space between the two SMA trend lines.
Analyzing the downside of this market, it would take bears to hold firm around the upper range line of $600. The crypto economy may most likely go to push downward afterward for a retest of the lower range line at $400. In the light of that presumed trading sentiment playing out as projected, support will have to build around the point. Therefore, bears will then have to stay off the market for a while.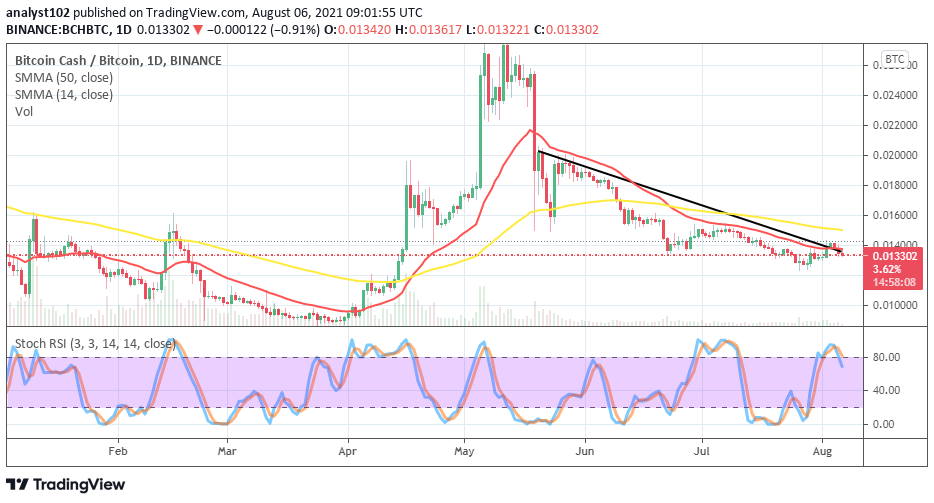
BCH/BTC Price Analysis
Comparing the trending force between BCH and BTC, it depicted that price trades sideways to some reasonable extent to denote that the base instrument is relatively overwhelmed by the counter tool. The bearish trend-line drew alongside the 14-day SMA trend-line beneath the 50-day SMA trend-line. The Stochastic Oscillators have crossed southbound from the overbought region to suggest that Bitcoin Cash may soon still lose the grand as placed with Bitcoin.
Note: Cryptosignals.org is not a financial advisor. Do your research before investing your funds in any financial asset or presented product or event. We are not responsible for your investing results.
You can purchase crypto coins here. Buy Tokens