Ethereum (ETH/USDT) Poised for More Upside Trajectory
Estimated Reading Time: 3 minutes
Don’t invest unless you’re prepared to lose all the money you invest. This is a high-risk investment and you are unlikely to be protected if something goes wrong. Take 2 minutes to learn more
Ethereum Long-term Analysis: Bullish
Recently, Ethereum has been making higher lows after a prolonged May-September downtrend. The recent price actions suggest some buying pressure is accumulating, with the current bullish candlestick showing 10.30% positive gains above the previous session.
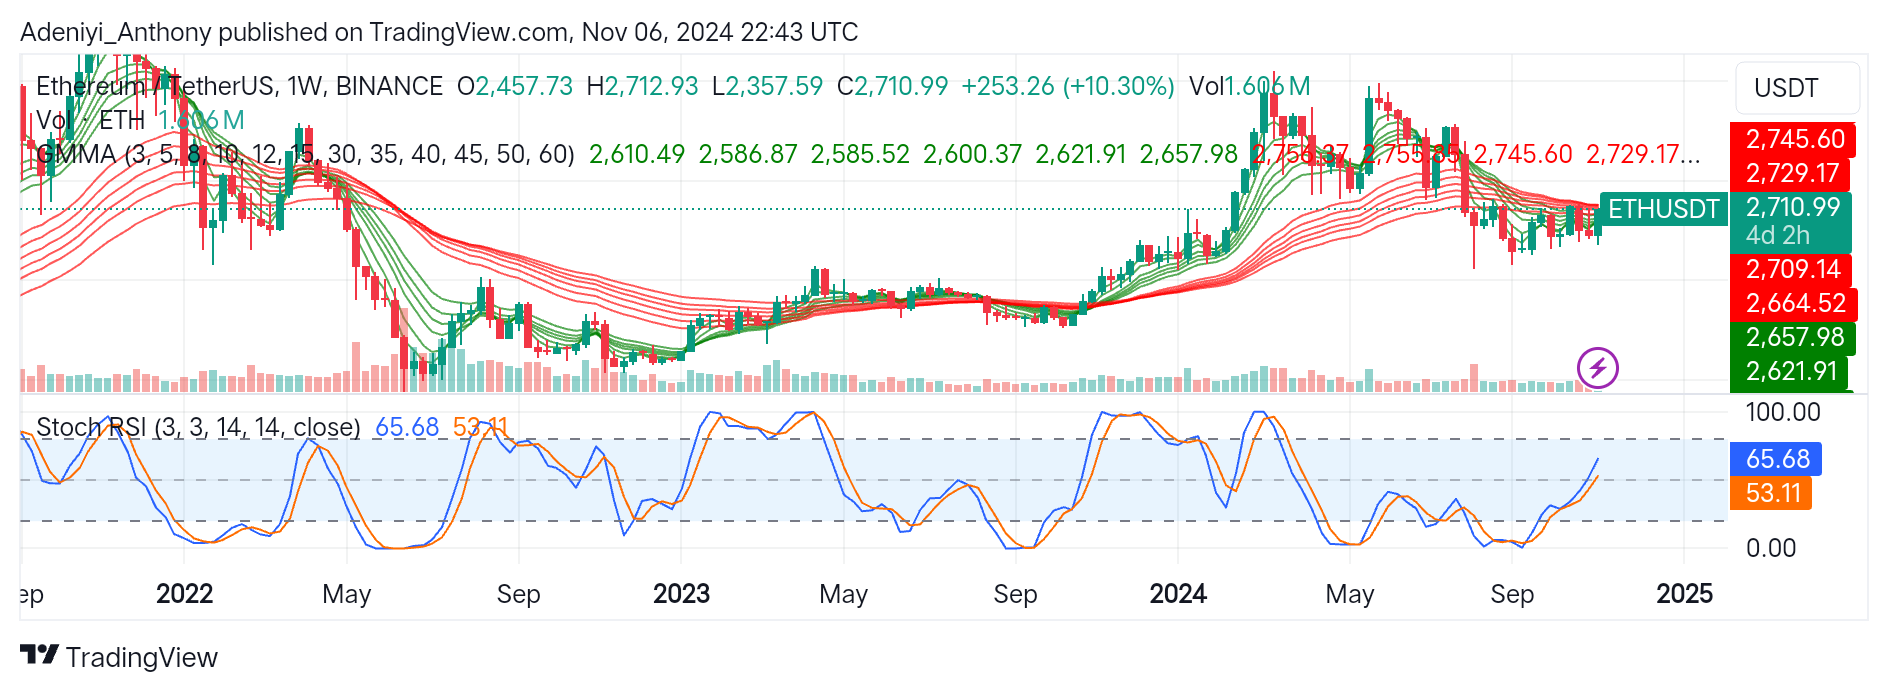
As it is, the set of averages seems to be converging; a full upside movement will be completed once the convergence is done. However, the condition of the Guppy Multiple Moving Averages (GMMA) suggests Ethereum against the Tether may see more upside recovery very soon. Conversely, any distortion of the convergence process may drive the price below the $2,610 level.
Currently, ETH/USDT is trading at $2,710.99, with the Stochastic RSI suggesting a possibility for a more upside trajectory.
Technical Indicator
Major Resistance Levels: $2,756.37, $2,780.85, and $2,800
Major Support Levels: $2,610.49, $2,586.87, and $2,585.52
Ethereum Technical Analysis
Ethereum on a weekly timeframe appears to be improving to the North with the convergence of the shorter and longer exponential moving averages. However, the price of ETH/USDT needs to break above the resistance levels at $2,756 to $2,780 for a confirmed upside recovery. To this end, a pullback closer to the $2,610.49 level or a consolidation phase in the near term is possible if the price fails to break above these levels.
On the other hand, the Stochastic RSI suggests ETH/USDT is steadily approaching the overbought region with 1.606 million trade volumes. The Stochastic oscillator indicates the pair can still improve, though caution is needed as the lines may move sideways before rising further.
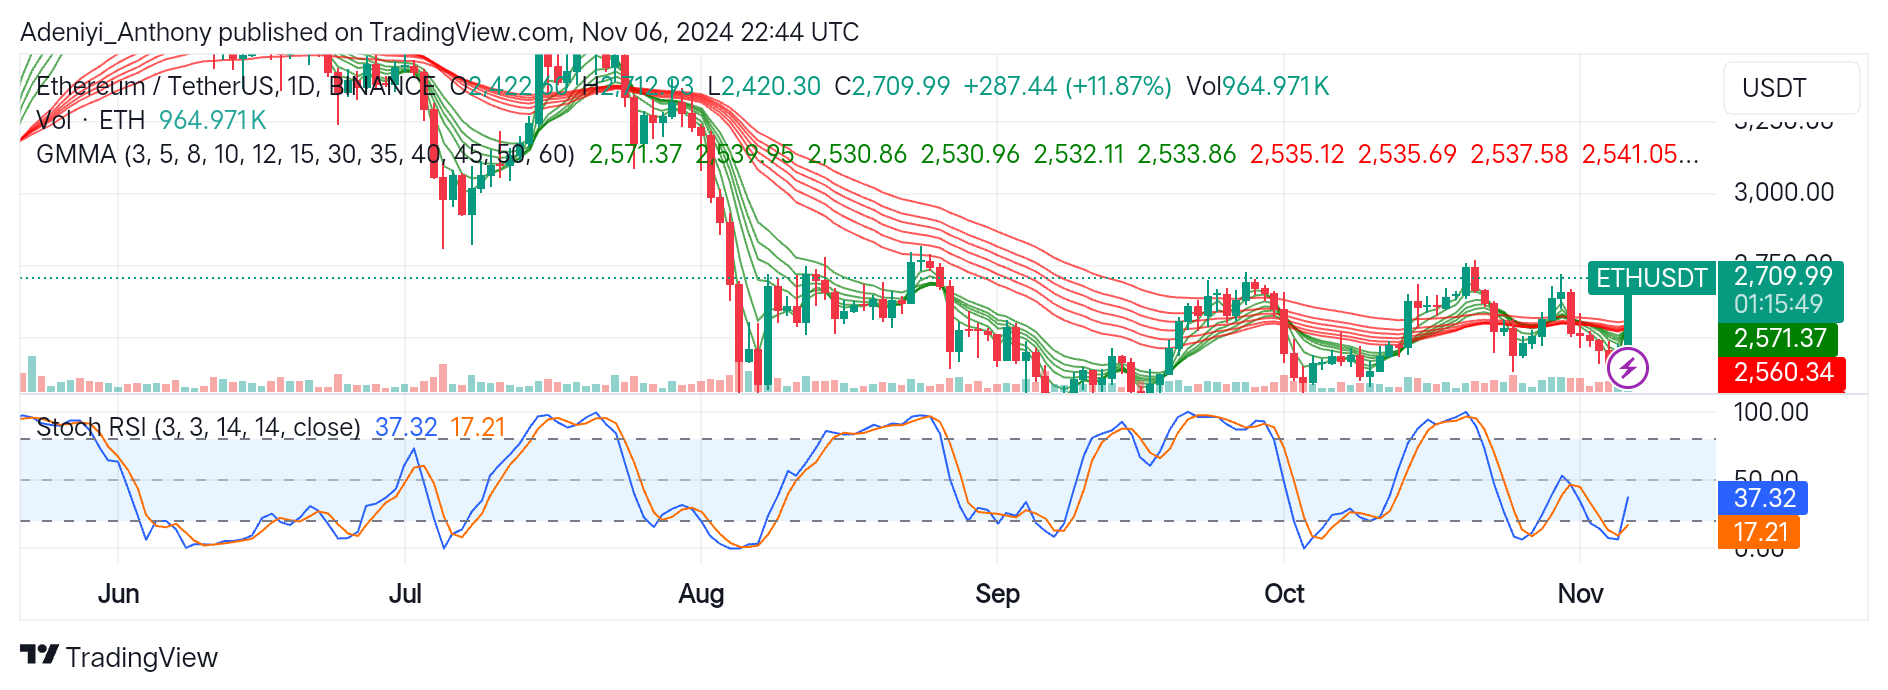
ETH/USDT Analysis: Consolidation or an Upside Movement
On a daily timeframe, ETH/USDT has seen an 11.87% positive change above previous trades with a moderate trading volume. However, for a continued uptrend, the shorter-term exponential averages must break above the longer-term exponential averages.
Moreover, the recent price actions on the chart suggest substantial buying pressure and potential for a full recovery to the North.
The price of ETH/USDT in this timeframe is $2,709.99; however, the Stochastic RSI suggests the pair operates in the oversold region despite the current bullish candlestick. This indicates more upside movement, as the price seeks to break higher resistance. At this juncture, traders should watch out for signs of exhaustion that may result in the divergence of the GMMA and the crossover of the lines of the Stochastic RSI.
You can purchase crypto coins here. Buy Block