Ethereum (ETH/USDT) Gears for an Upside Correction
Estimated Reading Time: 3 minutes
Don’t invest unless you’re prepared to lose all the money you invest. This is a high-risk investment and you are unlikely to be protected if something goes wrong. Take 2 minutes to learn more
Ethereum Long-term Analysis: Consolidating
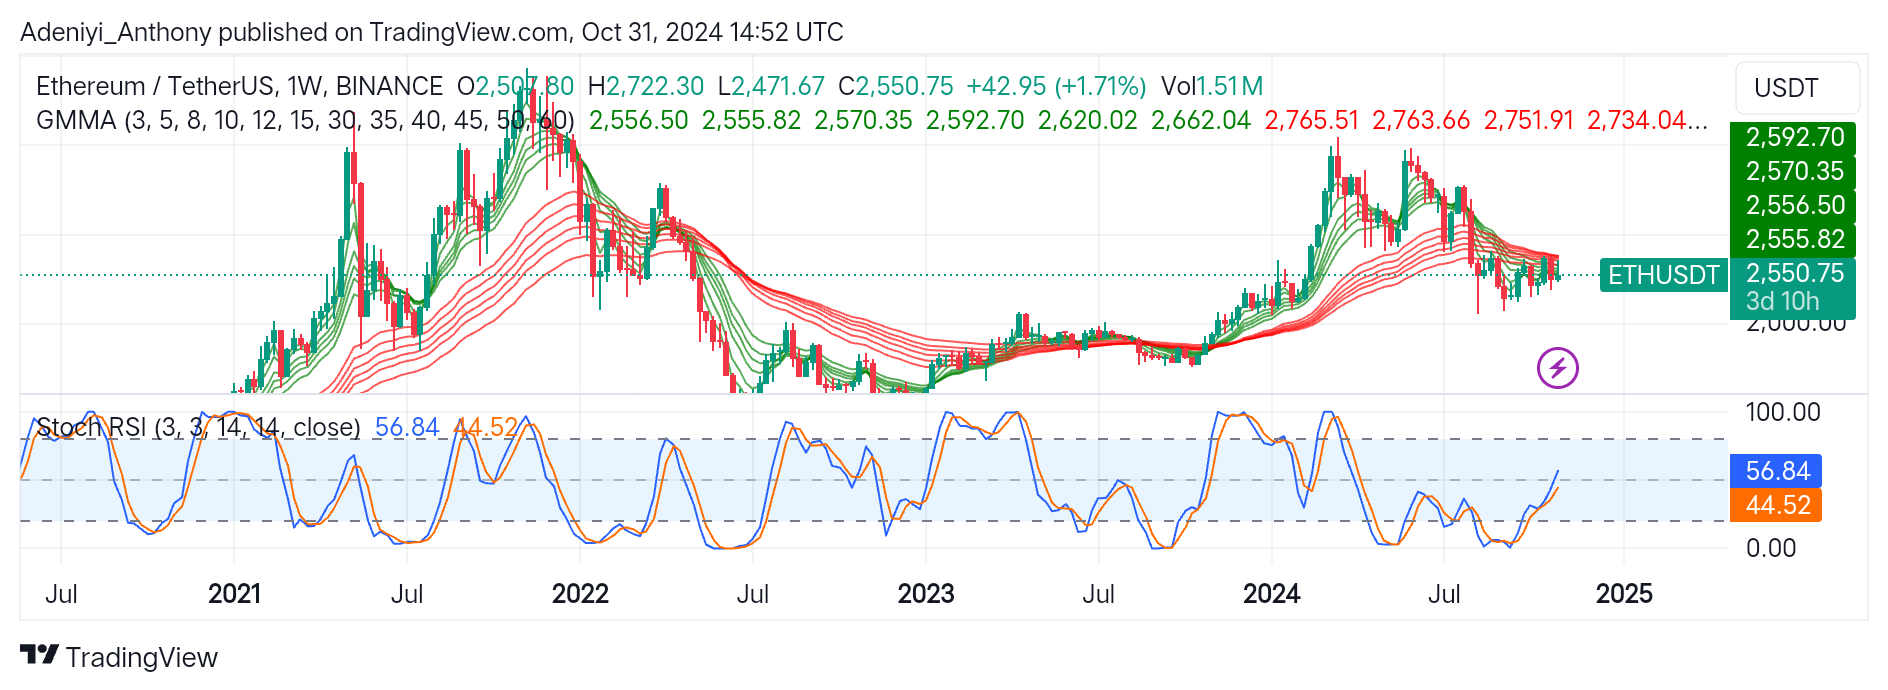
The Ethereum against the Tether on a weekly timeframe has seen a mixture of highs and lows this year. The pair is currently consolidating within close resistance and support levels with signs of an upside trajectory.
The recent price actions suggest a potential short-term upside correction, with the current price oscillating around previous high and low zones at $2,662 and $2,556.
The appearance of the Guppy Multiple Moving Averages (GMMA) reflects a cautious sentiment, though intertwined, but the shorter timeframes seem to be lagging behind. This may suggest a possible weakness in the trend. However, a clear crossover will cement the upside moves.
Currently, ETH/USDT trades at $2,551.41, with the Stochastic RSI indicating a slight bullish divergence, which suggests potential upward movement.
Technical Indicator
Major Resistance Levels: $2,662, $2,770, and $2,780
Major Support Levels: $2,556, $2,570, and $2,592
Ethereum Technical Analysis
Ethereum against the Tether is currently ranging within close range. However, the GMMA suggests if momentum increases, ETH may test the immediate resistance levels at $2,662; otherwise, failure at that level may lead to the retest of the immediate support level at $2,556.
On the other hand, the Stochastic RSI indicates there might be a short-term upside correction soon. However, this correction needs stronger volume and positive sentiment. Traders should watch out for the full crossover or a break above the immediate resistance before going long; otherwise, a break below the immediate support could signal a shift in market direction.
ETH/USDT Analysis: Where from Here?
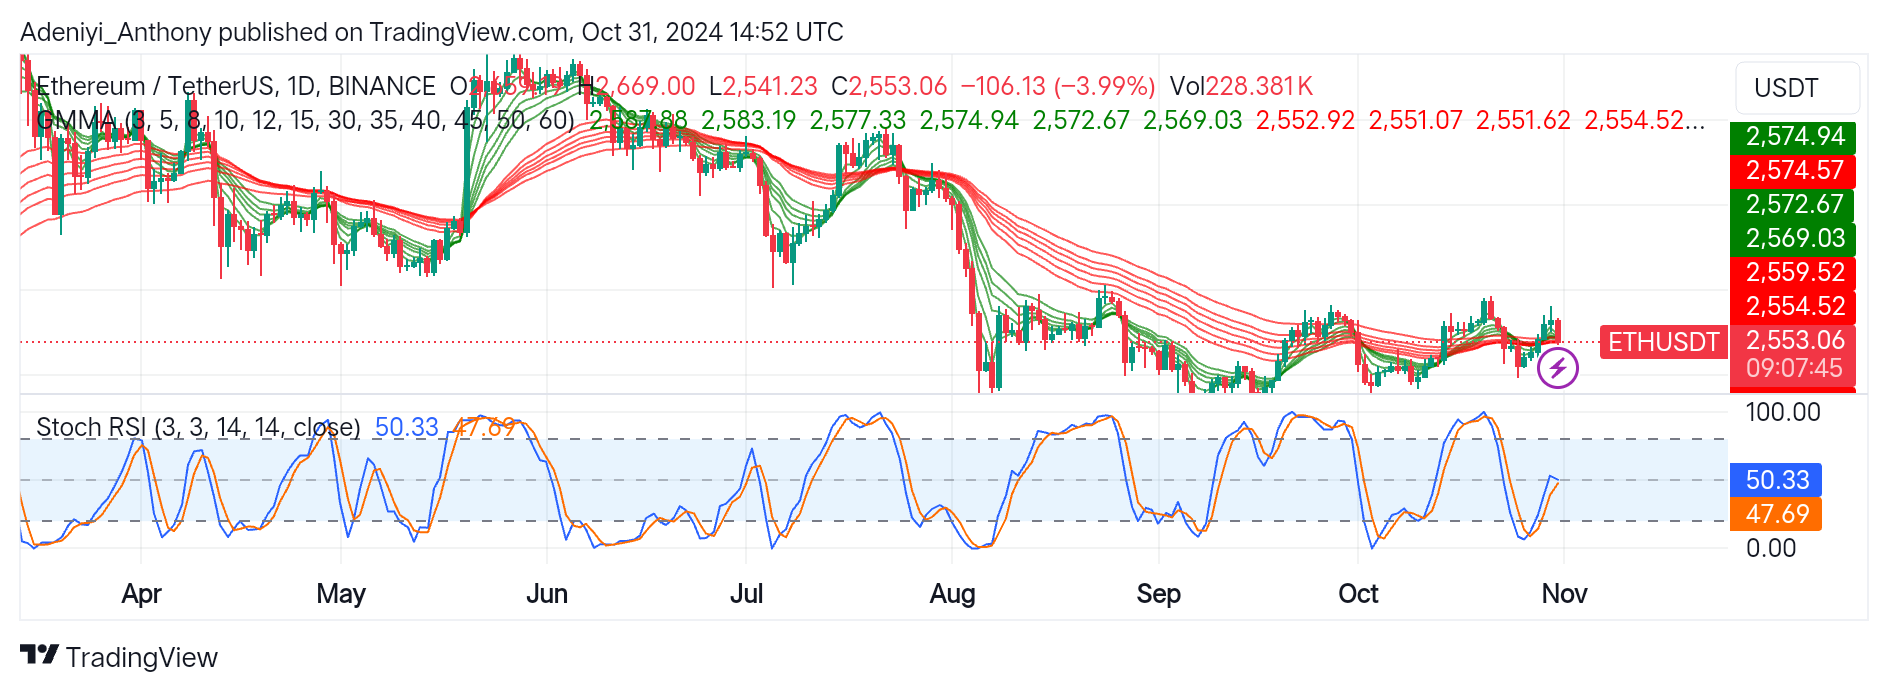
The ETH/USDT on the daily timeframe displays price movement within a narrower range, suggesting a period of consolidation. The GMMA seems to be intertwined in a downward direction, which indicates a bearish sentiment. However, the ETH/USDT is showing signs of correction in the short term; a potential upside movement will be guaranteed if the price breaks above the current resistance at $2,574. Conversely, a break below the immediate support level will lead to a further decline in price.
The Stochastic RSI suggests the price may continue the range-bound movement, as the lines on the oscillator are in the neutral zone. However, ETH can test the upper limit if buying power emerges; otherwise, further downside may see ETH/USDT retest the support around $2,551.
Traders should trade cautiously, as the market may consolidate further if pressure from either side is not forthcoming.
You can purchase crypto coins here. Buy LBlock