Dogecoin (DOGE) Price Prediction: DOGE/USDT Slumps Below an Important Technical Support
Estimated Reading Time: 3 minutes
Don’t invest unless you’re prepared to lose all the money you invest. This is a high-risk investment and you are unlikely to be protected if something goes wrong. Take 2 minutes to learn more

Dogecoin (DOGE) Price Prediction: June 10
Price action in the Dogecoin market has spent a considerable amount of time trading around the $0.1600 mark. However, there was a sudden crash through the $0.1600 mark and below the next support level of $0.1500. Consequently, this has renewed bearish momentum in the market and may cause further price declines.
DOGE/USDT Long-term Trend: Bullish (Daily Chart)
Key Price Levels:
Resistance Levels: $0.1600, $0.1800, and $0.2000
Support Levels: $0.1400, $0.1200, and $0.1000
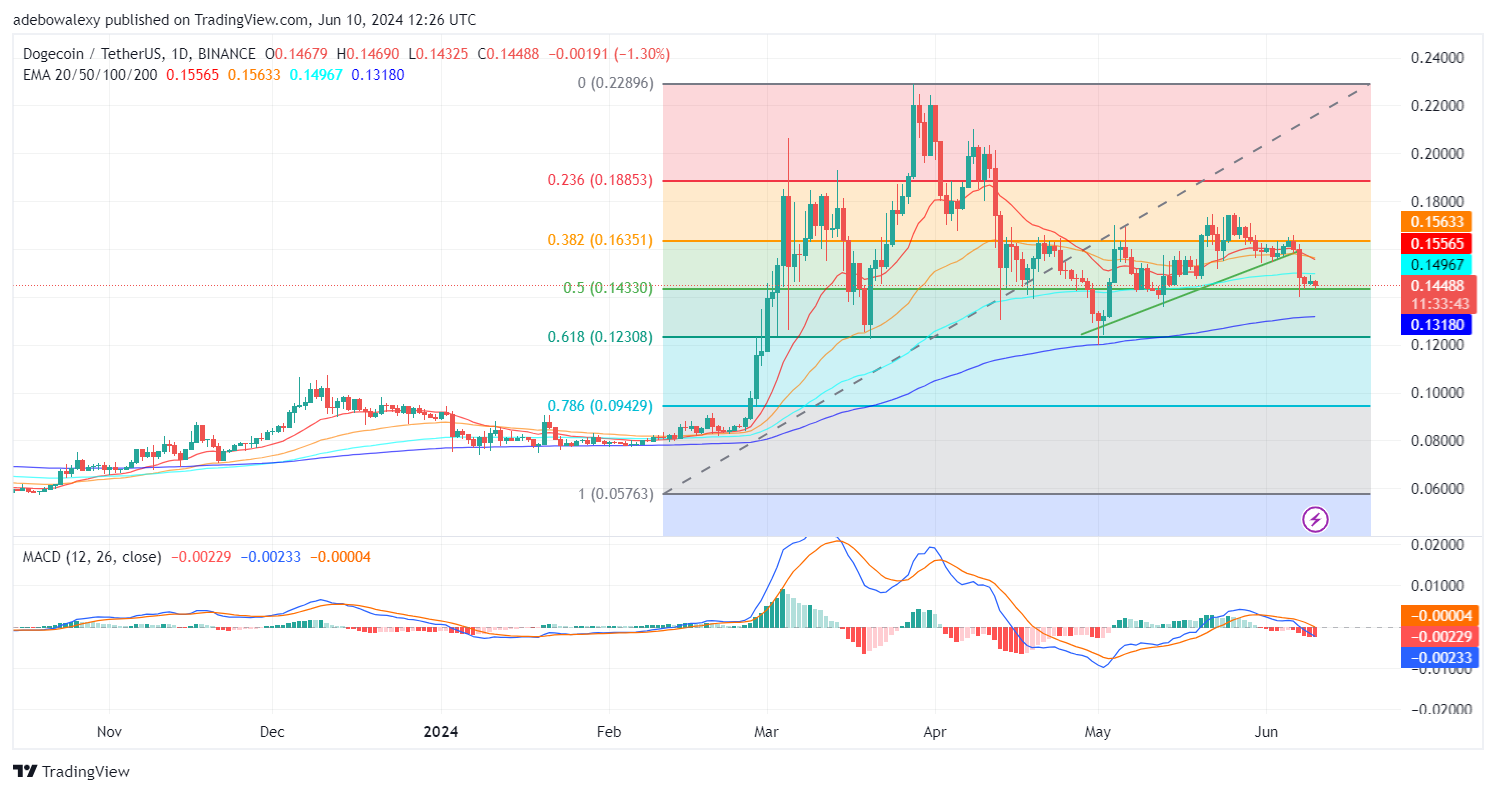
While Dogecoin has been oscillating largely between the Fibonacci Retracement levels of 50% and 38.2%, the market saw one of the most significant price declines during the past three sessions. Consequently, this brought the market below the 100-day Exponential Moving Average (EMA) line. Nevertheless, the current session continues above the 50% Fibonacci Retracement level and the 200-day EMA line.
Dogecoin Price Prediction: DOGE/USDT Bearish Propensity Intensifies
The DOGE/USDT 4-hour price chart reveals that the market has gained notable bearish momentum. This was revealed as price action fell below three out of the four EMA lines on this chart. Be that as it may, it can be observed that the support at the 50% Fibonacci Retracement level is still holding at the moment, offering a baseline for an upward rebound.
Simultaneously, the Moving Average Convergence Divergence (MACD) lines are now below the equilibrium level. The bars of the mentioned indicator are solid red, affirming bearish dominance and the likelihood of price action soon tearing through the defense at the $0.1433 price level.
DOGE/USDT Medium-term Trend: Dogecoin Presents a Weak Defensive Line (4H Chart)
In the DOGE/USDT 4-hour market, we can see that the market had rebounded upwards in the previous session. Meanwhile, trading activities are happening below all the EMA lines. The ongoing session has appeared as a tiny price candle, causing hardly any change in the token’s price from the previous session. However, the MACD indicator lines seem almost parallel to the equilibrium level while below it. Even its bars are almost invisible above the equilibrium level.
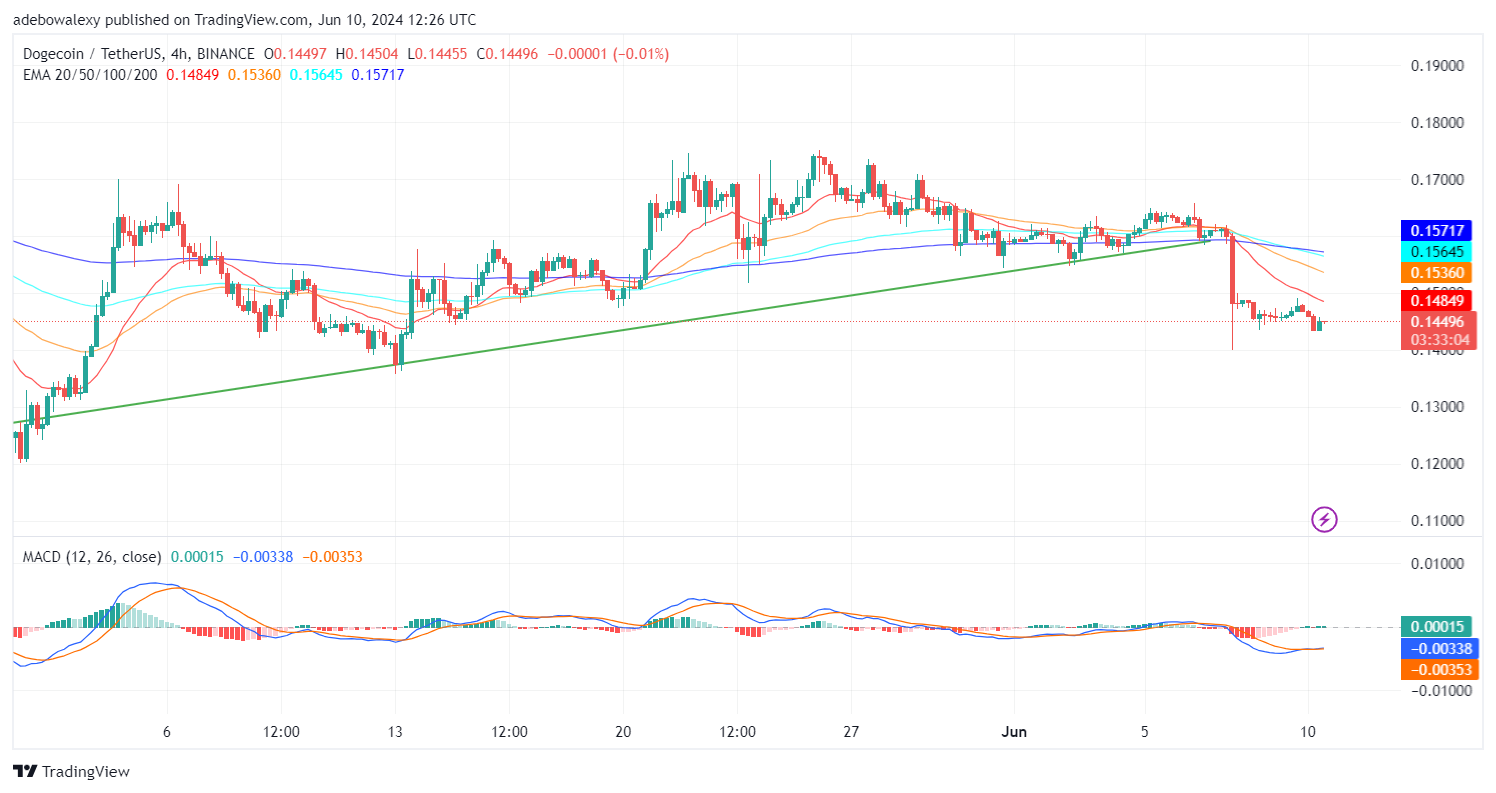
The current position of the market suggests that headwinds are the most significant influence. This opinion is consistent with the signs emanating from technical indicators. All the EMA lines are above price movement. Also, the last price candle on the chart is red, while the MACD lines give no indication of a possible bullish recovery. Therefore, market participants can anticipate that price action may reach the $0.1400 mark.