Litecoin (LTC/USD) Market Succumbs to a Light Correction
Estimated Reading Time: 3 minutes
Don’t invest unless you’re prepared to lose all the money you invest. This is a high-risk investment and you are unlikely to be protected if something goes wrong. Take 2 minutes to learn more

Free Crypto Signals Channel
 Free Telegram Channel
Litecoin Price Prediction – September 7
The LTC/USD market operation succumbs to a light correction after hitting resistance at a psychological trading line. Price has been featuring low and high with $54 and $52 value lines at an average percentage rate of 0.58 positive.
LTC/USD Market
Key Levels:
Resistance levels: $65, $75, $85
Support levels: $45, $35, $25
LTC/USD – Daily Chart
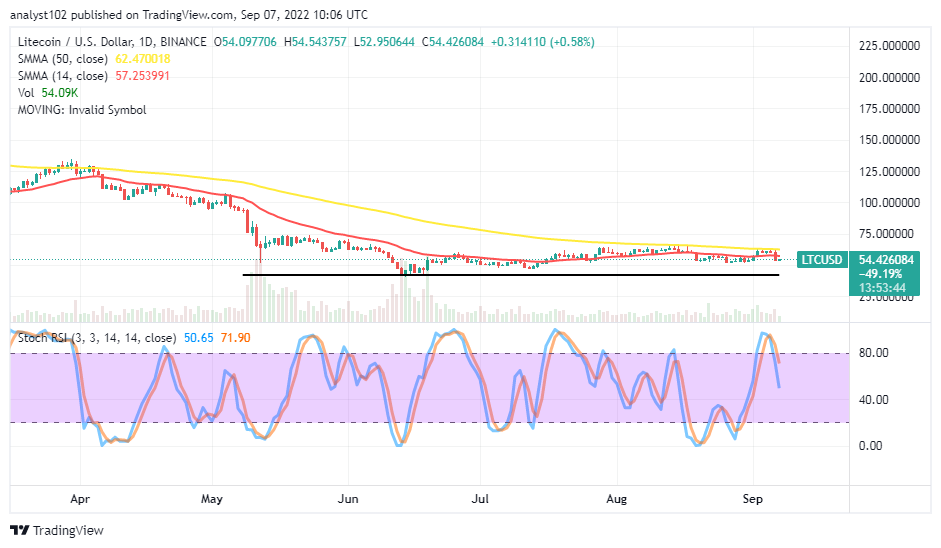
The daily chart reveals the LTC/USD market operation succumbs to a light correction as it pushes southward briefly past the smaller SMA. The 14-day SMA indicator is at $57.25 below the 50-day SMA indicator, which is at $62.47. The horizontal line remains drawn around the $42 support level, indicating the maximal lower-trading spot the market has been springing northward. The Stochastic Oscillators have crossed southbound from the overbought region to reach 71.90 and 50.65 range values.
Will the LTC/USD market further in a correction below the SMAs?
As the current trading outlook portends the LTC/USD trade, that price can likely further go down as been established that the crypto market succumbs to a light correction. Forces to the downside yet keep a slow and steady motion as of the writing. Therefore, buyers needed to allow a change of trading pattern to take a form that will see the Stochastic Oscillators reading to portend a return of an upward move.
On the downside of the technical analysis, the LTC/USD has reversed southward to break either breach past some psychological level that it has been found uneasy in the previous sessions around $53 or thereabout. Presently, the positioning of the Stochastic Oscillators yet suggests that some downward-trending motions may achieve. The horizontal line drawn at the $42 level remains intently technical to a critical situation of getting to an intense bearish movement that the market may produce in the long run.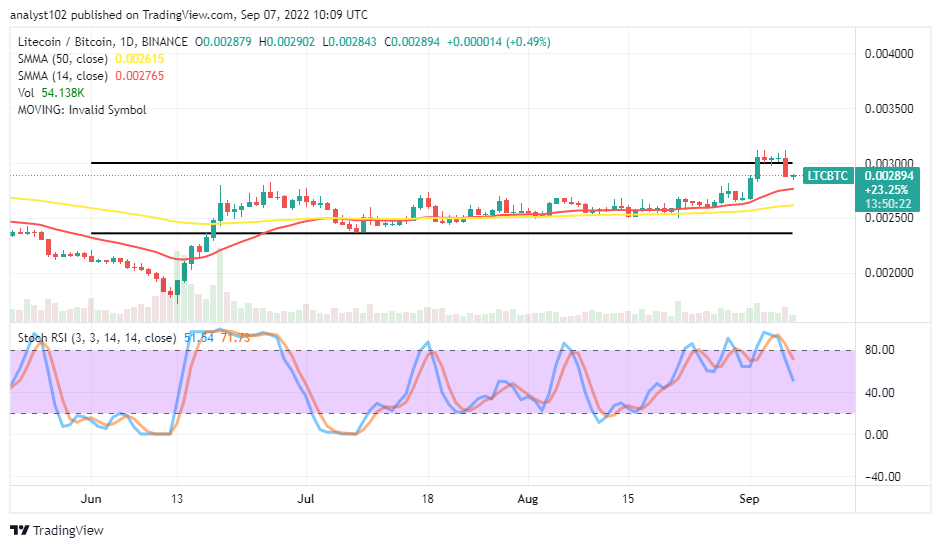
LTC/BTC Price Analysis
Litecoin’s trending capacity against Bitcoin has seemingly resumed a declining trend around the upper range line drawn B0.003000. The 14-day SMA indicator is above the 50-day SMA indicator. And they are within the range-bound zones. The lower range line is at B0.002360. The Stochastic Oscillators have crossed southbound from the overbought region to the ranges of 71.73 and 51.54. It appears the base altcoin stands the risk of downsizing against its counter-trading crypto.
Note: Cryptosignals.org is not a financial advisor. Do your research before investing your funds in any financial asset or presented product or event. We are not responsible for your investing results.
You can purchase Lucky Block here. Buy LBLOCK