Polygon (POL) Price Prediction: POL/USDT Trades Below the $0.4000 Threshold
Estimated Reading Time: 3 minutes
Don’t invest unless you’re prepared to lose all the money you invest. This is a high-risk investment and you are unlikely to be protected if something goes wrong. Take 2 minutes to learn more

Polygon (POL) Price Prediction: September 21
The Polygon market is currently trading below the $0.4000 threshold after breaking away from a steady downtrend that started in June. At this point, the market has significantly reduced volatility but appears to be rising steadily upward.
POL/USDT Long-term Trend: Bullish (Daily Chart)
Key Price Levels:
Resistance: $0.4000, $0.4500, $0.5000
Support: $0.3500, $0.3000, $0.2500
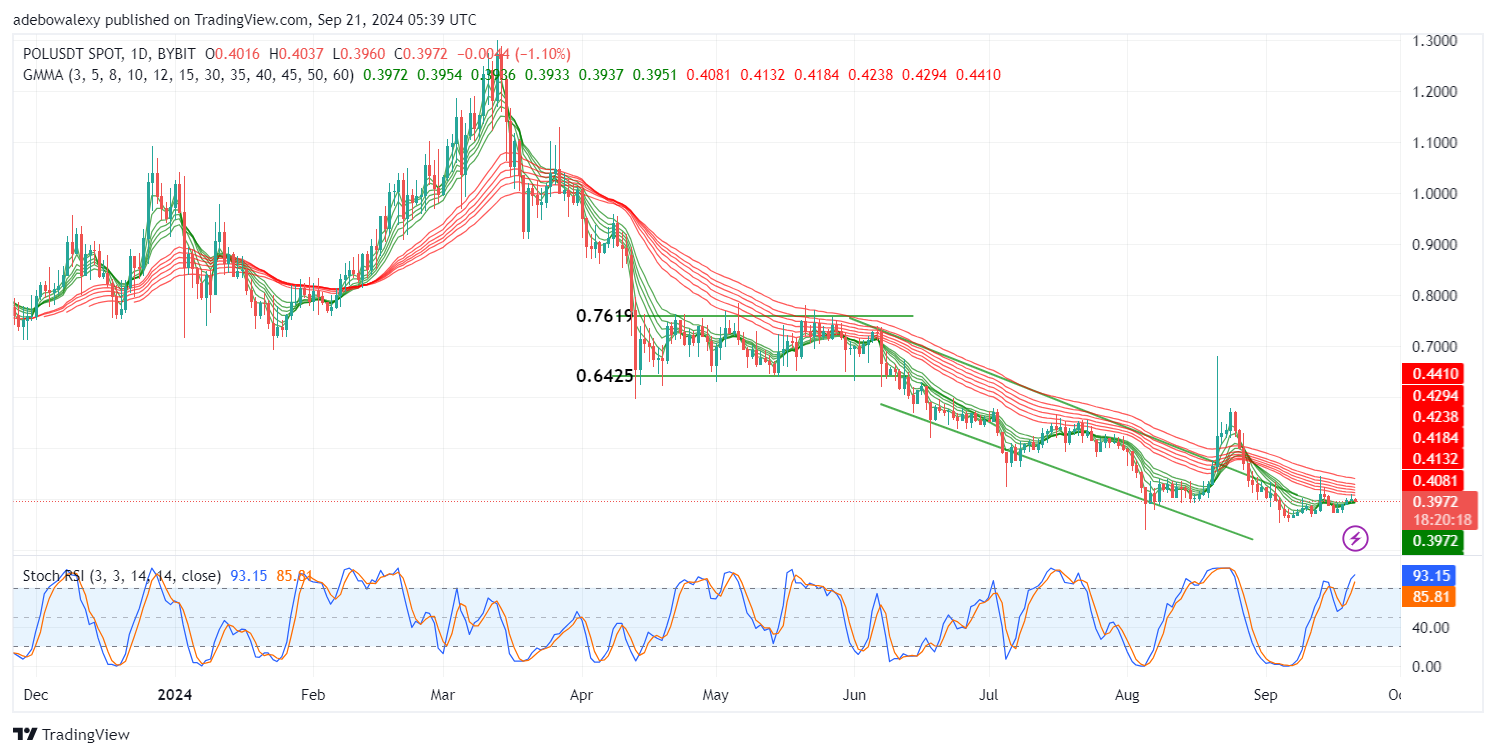
Price activity in the POL/USDT market has only seen minimal movement at this point. The last price candle displayed a slight downward retracement but remained above all the converged green Guppy Multiple Moving Average (GMMA) lines. Meanwhile, all the red GMMA curves lie above price activity and remain unconverged. The Stochastic Relative Strength Index (Stochastic RSI) indicator on this price chart maintains an upward trajectory, though its leading lines seem deflected in response to the minor downward retracement in the session.
Polygon (POL) Price Prediction: POL/USDT Suffers From Low Participation
As seen, the Polygon market has reduced volatility, but it has deviated from the medium-term downward trajectory that started in June. However, the market shows signs of rising steadily upward despite the low volatility.
The last price candle on the chart places the pair just above the green set of GMMA indicator lines. Additionally, the Stochastic RSI maintains a general upward trajectory. This suggests that despite the negatives, the market may continue upward through the $0.4000 price level.
Polygon (POL) Price Prediction: POL/USDT Market Still Has Some Protection (4-Hour Chart)
Polygon’s price action appears to be trading more sideways on the 4-hour price chart. The market continues to hover around the green set of GMMA lines. Meanwhile, all this activity occurs above the red GMMA indicator lines. However, the Stochastic RSI lines have fallen exaggeratedly into the oversold region.
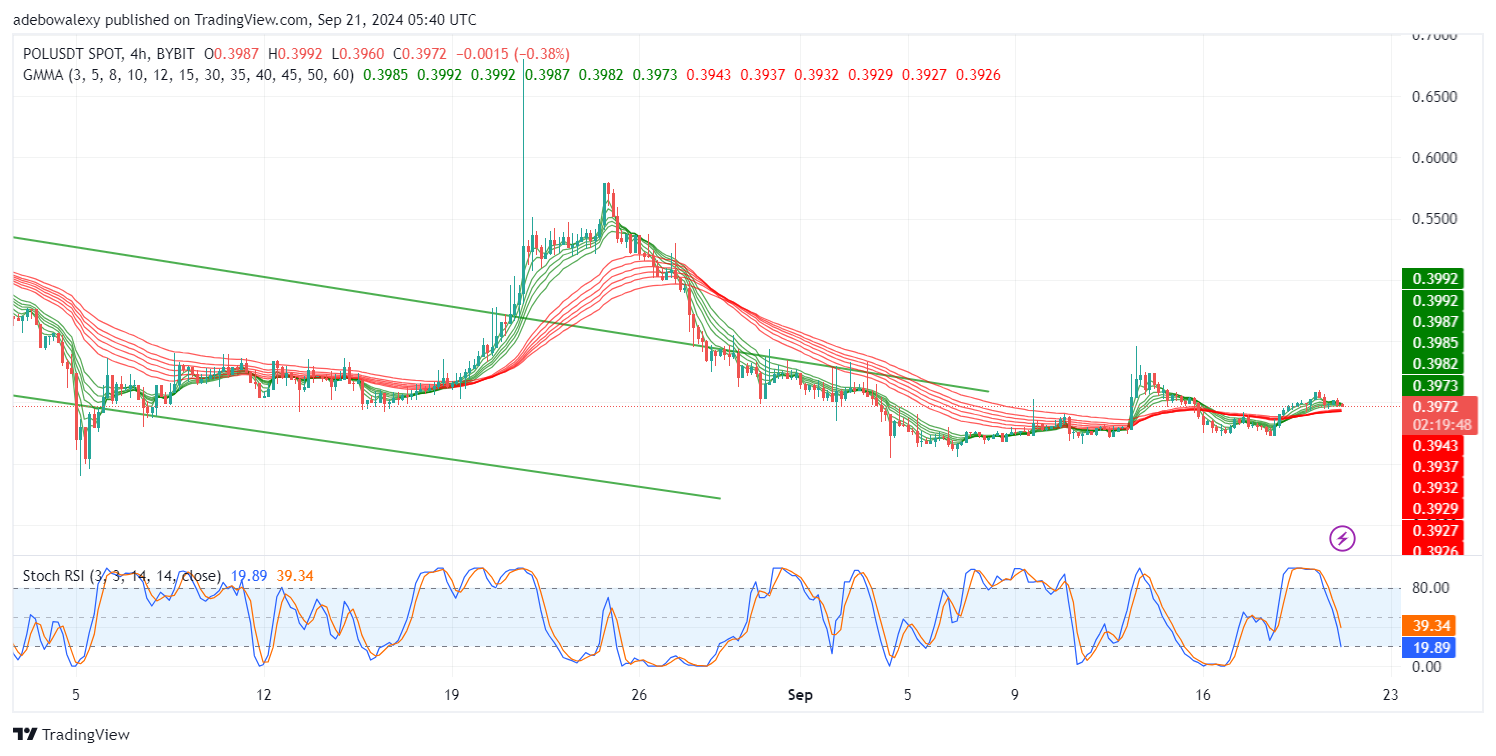
Technically, this seems contradictory. However, judging by the exaggerated movement of the Stochastic RSI lines, it appears that downward forces are quietly losing momentum. Additionally, the position of price action above the red GMMA lines indicates that the market may maintain a steady upward retracement through the $0.4000 resistance level.