Lucky Block (LBLOCK): Momentum Builds as RSI Strengthens
Estimated Reading Time: 3 minutes
Don’t invest unless you’re prepared to lose all the money you invest. This is a high-risk investment and you are unlikely to be protected if something goes wrong. Take 2 minutes to learn more

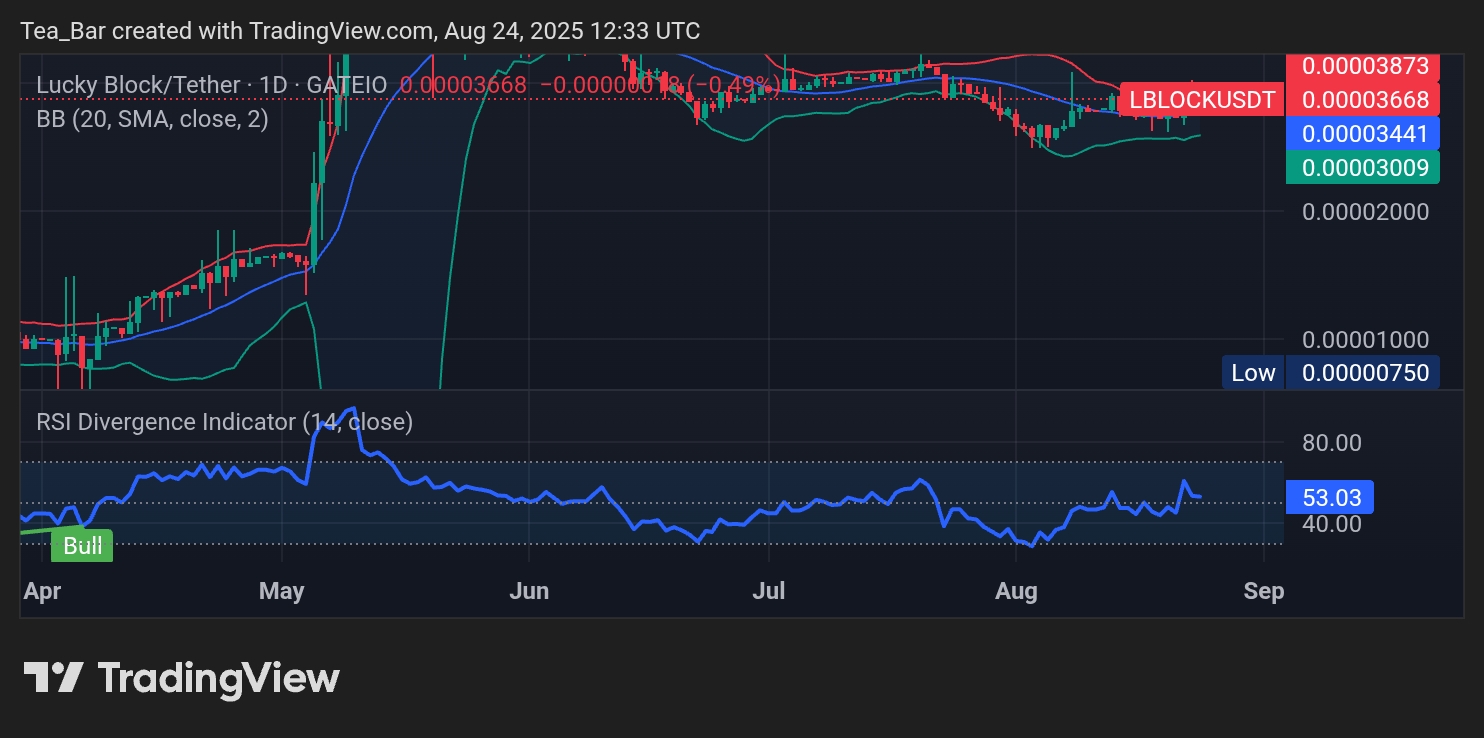
Lucky Block (LBLOCK) is trading at $0.00003668 on as of August 24, 2025, showing resilience despite recent pullbacks. The charts reveal tightening ranges, an improving RSI profile, and signs of consolidation near critical support. Together, these factors suggest that LBLOCK may be building energy for its next directional move.
Daily Chart: RSI Recovery Signals Growing Buyer Confidence
On the daily timeframe, LBLOCK continues to hold above the $0.00003009 support zone, with resistance overhead at $0.00003873. Price remains compressed within the Bollinger Bands, reflecting reduced volatility and suggesting that a larger move could be imminent. The fact that LBLOCK has not broken down further despite broader market weakness points to underlying accumulation.
The RSI reading of 53.03 adds weight to the bullish case. After weeks hovering near oversold levels, the indicator has climbed into neutral territory, marking a shift in momentum toward the buyers. Historically, this type of mid-zone RSI recovery often precedes stronger uptrends, especially when combined with price stability at support. A sustained push above $0.00003873 could trigger upside momentum toward $0.00004500.
4-Hour Chart: Divergences Highlight a Bullish Tilt
Zooming into the 4-hour view, LBLOCK shows steady strength around the $0.00003482–$0.00003541 zone, with the RSI holding at 55.35. The presence of multiple “Bull” divergence markers on the RSI indicator suggests growing demand after short-term weakness. Price has also respected the mid-Bollinger Band, indicating that buyers are active in defending dips.

The resistance zone near $0.00003948 remains the level to beat. A clean breakout above this line could accelerate buying pressure and open the path toward $0.00004500 in the near term. Conversely, failure to hold the $0.00003441 support floor could delay bullish ambitions. For now, RSI divergence paired with narrowing bands suggests momentum is leaning upward.
Conclusion: Breakout Watch Intensifies
LBLOCK is showing the classic hallmarks of a market preparing for expansion — Bollinger Band squeezes, RSI recovery, and divergence signals on lower timeframes. As long as support near $0.00003441 holds, the token appears poised for a potential breakout attempt toward $0.00003948 and higher.
Invest wisely, and let Lucky Block’s potential work in your favor. You can purchase Lucky Block here. Buy LBLOCK.