Lucky Block (LBLOCK): Bullish Signals Forming as Momentum Build
Estimated Reading Time: 3 minutes
Don’t invest unless you’re prepared to lose all the money you invest. This is a high-risk investment and you are unlikely to be protected if something goes wrong. Take 2 minutes to learn more

Lucky Block (LBLOCK) continues to attract attention as its price consolidates around $0.00003435 as of August 16, 2025. Despite facing pressure from recent market volatility, both the daily and 4-hour charts suggest that a breakout may be brewing. With supportive technical indicators like Parabolic SAR and MACD beginning to align, the current consolidation could be laying the groundwork for the next bullish phase.
Daily Chart: Support Holds as Momentum Shifts
The daily timeframe shows LBLOCK defending the $0.00003024 support zone, a level that has become increasingly important for buyers. After dipping earlier in August, price stabilized and is now consolidating above this floor. The Parabolic SAR has flipped beneath price action, hinting at early signs of a trend reversal. If sustained, this indicator shift strengthens the argument that downside momentum is easing.
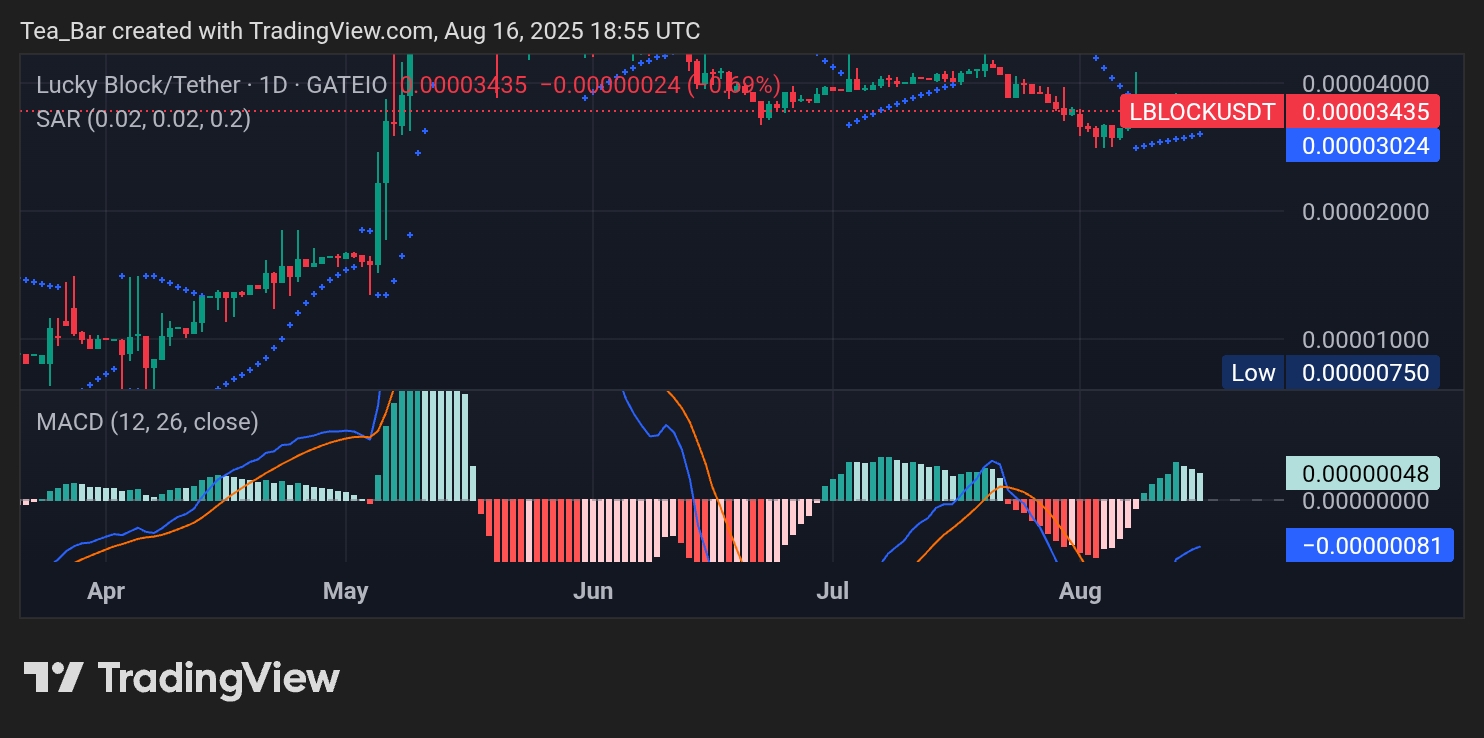
At the same time, the MACD on the daily chart reveals improving momentum. The histogram has moved closer to neutral, while the MACD and signal lines appear to be stabilizing after weeks of bearish pressure. This suggests a potential crossover is in the making. Should momentum build from here, resistance at $0.00004000 could become the next upside test.
4-Hour Chart: Compression Near Key Resistance
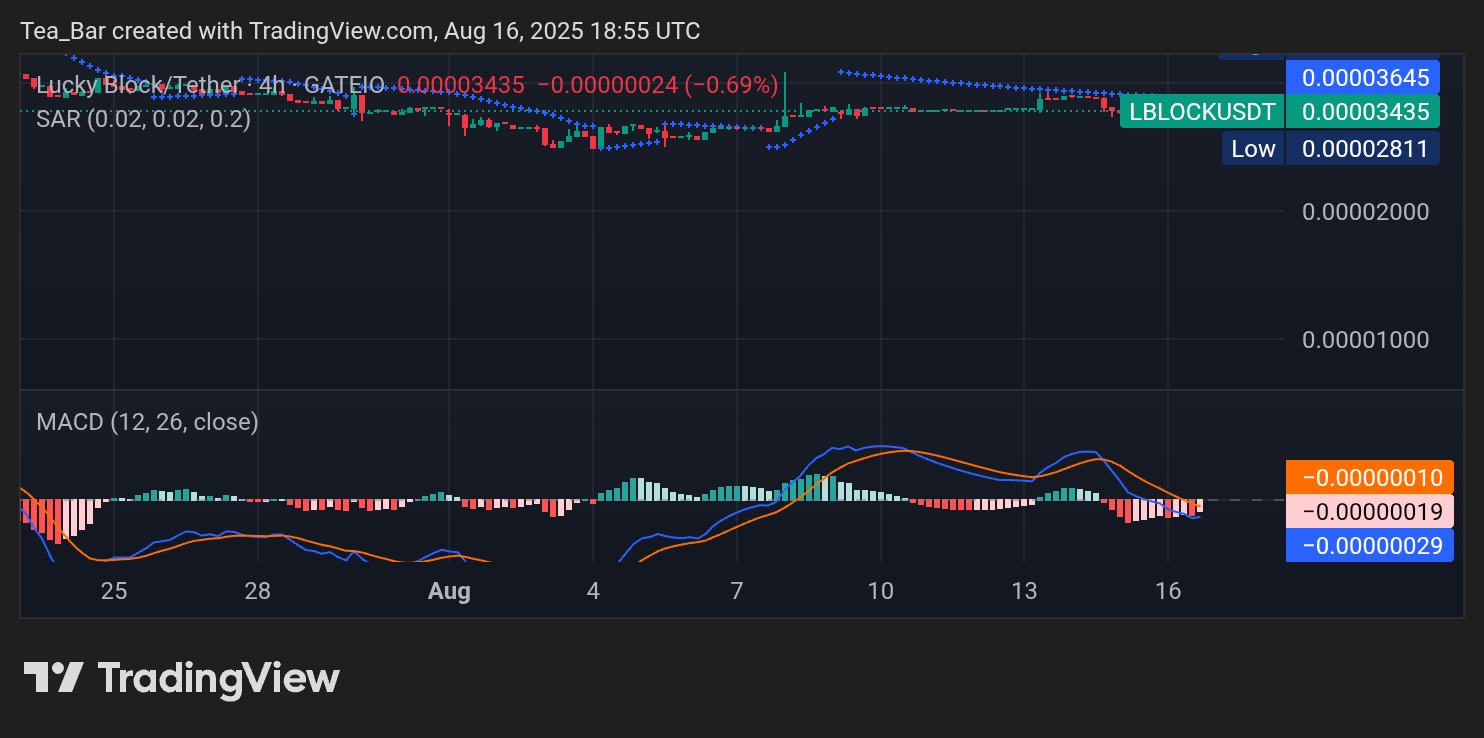
On the 4-hour timeframe, LBLOCK trades tightly between support at $0.00003261 and resistance around $0.00003439. The narrowing price action is confirmed by the flattening Parabolic SAR, signaling compression ahead of a potential breakout. Buyers have consistently defended the $0.00003261 zone, creating a series of higher lows that hint at underlying accumulation.
The MACD on the 4-hour view also reflects a neutral but coiling structure. Although the histogram has recently turned red, the distance between MACD and signal lines remains tight, suggesting a breakout move may be near. A decisive push above $0.00003439 could quickly drive price toward $0.00003645, unlocking stronger bullish momentum.
Conclusion: LBLOCK Prepares for Its Next Move
Lucky Block’s price structure is showing resilience, with both daily and 4-hour indicators signaling reduced bearish momentum. The alignment of Parabolic SAR and a stabilizing MACD suggests buyers are gradually regaining control. If key resistance levels are breached, LBLOCK could be on the verge of a stronger rally.
Invest wisely, and let Lucky Block’s potential work in your favor. You can purchase Lucky Block here. Buy LBLOCK.