Dogecoin Price Prediction: DOGE/USDT Bears Continue to Dominate with Minimal Gains
Estimated Reading Time: 2 minutes
Don’t invest unless you’re prepared to lose all the money you invest. This is a high-risk investment and you are unlikely to be protected if something goes wrong. Take 2 minutes to learn more

Dogecoin Price Prediction (March 31, 2025)
The Dogecoin market has continued downward even after attempting to surpass the $0.2000 price level. That breakout attempt failed, leading to a notable price decline. However, the downward retracement appears to be losing momentum, as reflected in price action.
DOGE/USDT Long-Term Trend: Bearish (Daily Chart)
Key Price Levels:
Resistance: $0.2500, $0.3000, $0.3500
Support: $0.2000, $0.1500, $0.1000
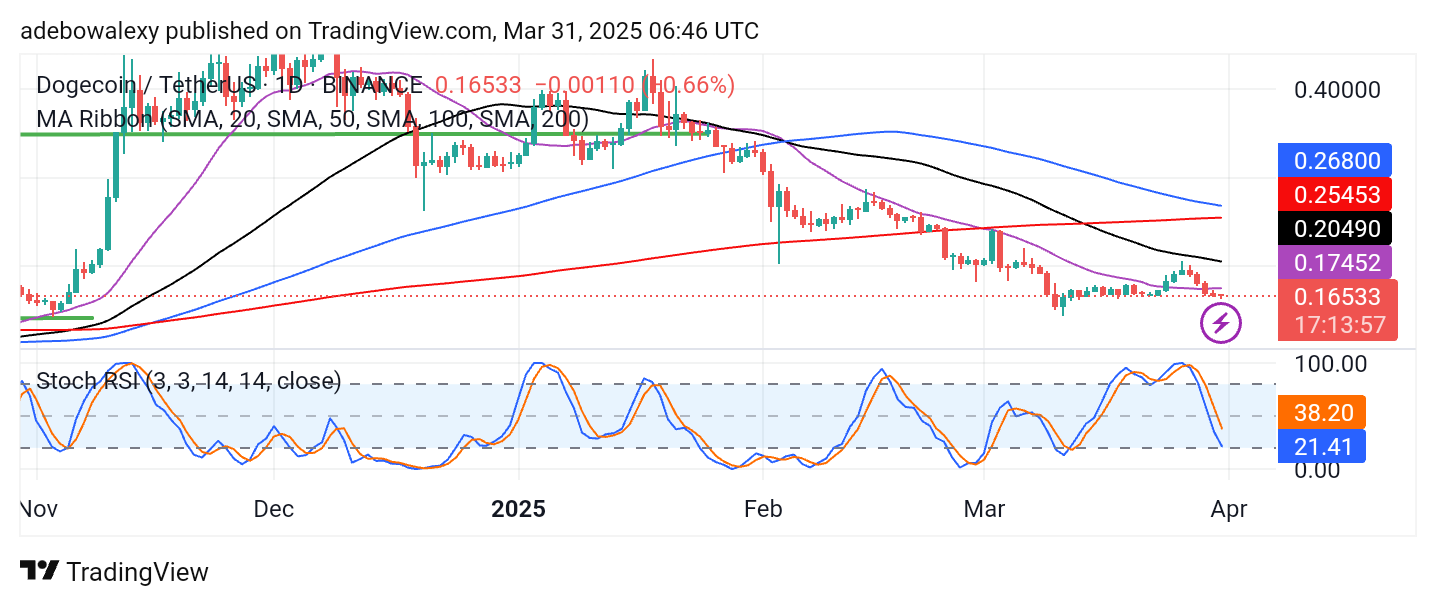
The previous session’s price candle has closed below all the Moving Average (MA) lines, and the ongoing session’s candle has also formed below them. These price candles are red, signaling bearish dominance, although the momentum appears weak. Additionally, the Stochastic Relative Strength Index (RSI) continues to decline into the oversold region. The indicator lines are currently positioned at 21 and 38, indicating that bearish pressure remains prevalent.
Dogecoin Price Prediction: DOGE/USDT Aims for Lower Levels
The Dogecoin market remains subdued, with price action still trending downward. However, the declining momentum suggests that the retracement is progressing with difficulty. The latest price candle is smaller than the previous one, yet it remains bearish.
Furthermore, the Stochastic RSI lines are falling sharply into the oversold region, indicating that downward forces are still in control. As a result, a further price decline may occur in the near term.
Dogecoin Price Prediction: DOGE/USDT Faces Resistance Despite Minor Gains (4-Hour Chart)
On the 4-hour chart, Dogecoin has posted some minor gains, as represented by a green price candle in the ongoing session. However, these gains have occurred below all the MA lines, suggesting that upward retracement will face strong resistance.
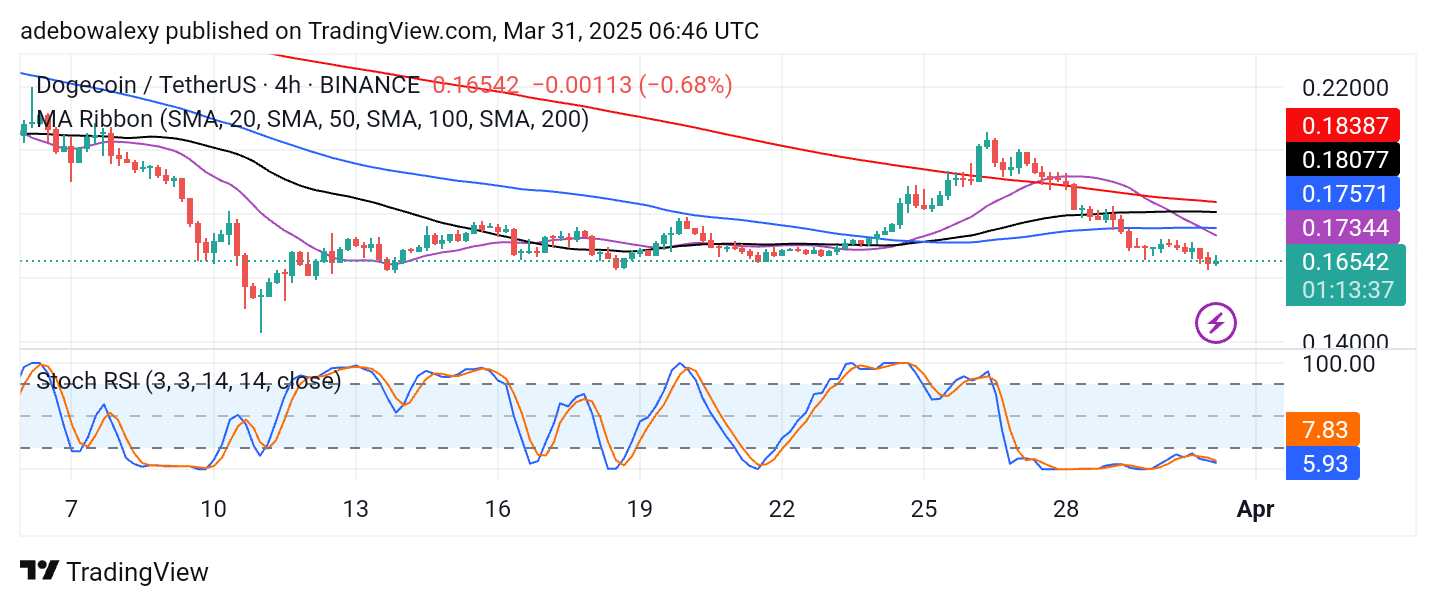
The Stochastic RSI lines remain in the oversold region, showing no signs of an impending crossover. This suggests that bearish pressure is still dominant, and traders should brace for a potential further decline toward the $0.1500 support level.