POL (ex-MATIC) Price Prediction: POL/USDT Approaches the $0.2000 Level
Estimated Reading Time: 2 minutes
Don’t invest unless you’re prepared to lose all the money you invest. This is a high-risk investment and you are unlikely to be protected if something goes wrong. Take 2 minutes to learn more

POL (ex-MATIC) Price Prediction (March 29)
The POL (ex-MATIC) market has continued its steady downward movement. For an extended period, price action has been declining to lower levels. The market recently pushed through some key technical levels but was pulled back downward.
POL/USDT Long-Term Trend: Bearish (Daily Chart)
Key Price Levels:
Resistance: $0.2500, $0.3000, $0.3500
Support: $0.2000, $0.1500, $0.1000
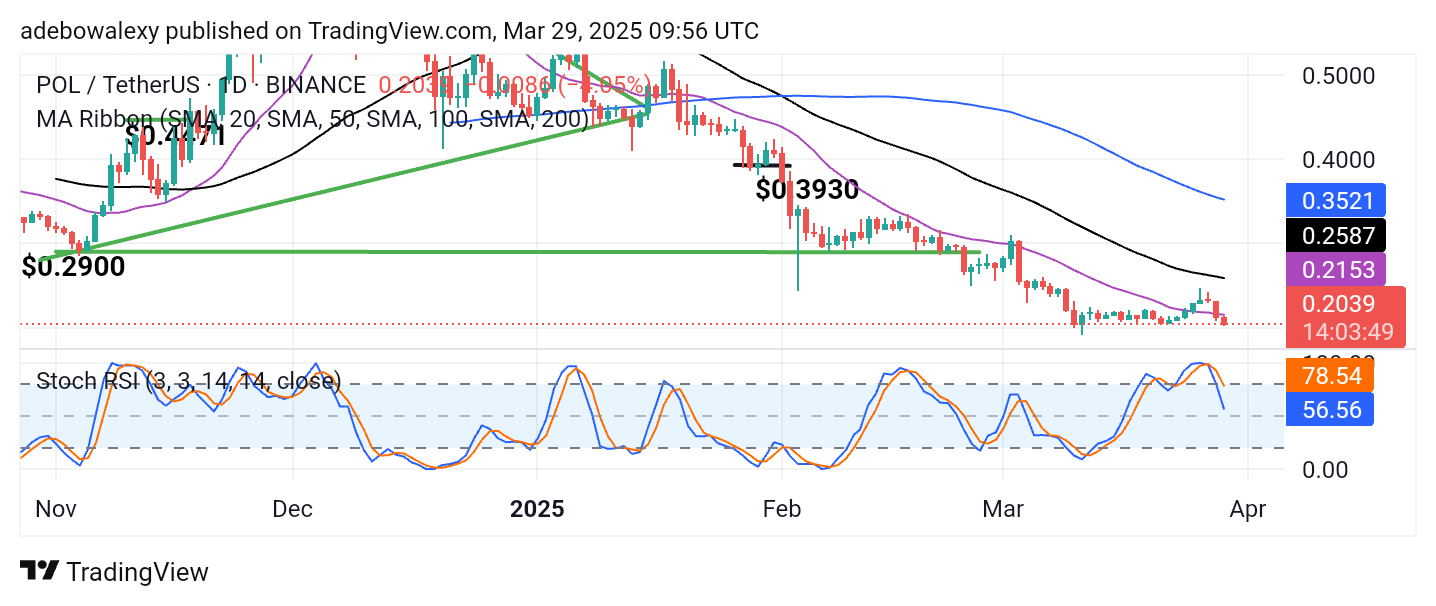
The POL (ex-MATIC) market remains vulnerable. The last price candle on this chart has fallen back below the 20-day Moving Average (MA) lines. As a result, price action now lies below all the available MA lines on the chart. The Stochastic Relative Strength Index (RSI) lines have also fallen sharply below the 80 mark. The lead line is now below the 60 level, while the lagging line stands at the 78.54 threshold.
POL (ex-MATIC) Price Prediction: POL/USDT Has Bearish Momentum
From a technical indicator perspective, the POL (ex-MATIC) market remains under bearish pressure. As previously noted, price action has fallen below all the MA lines, signaling that downward forces are still dominant.
The movement of the Stochastic RSI indicator also does not indicate much positivity, as the indicator lines are now falling toward the oversold region. Consequently, downward forces may breach the next psychological support level, which has been holding for a while.
POL (ex-MATIC) Price Prediction: POL/USDT Bears May Face Resistance Soon (4-Hour Chart)
Extending the scope of POL (ex-MATIC) price analysis to a 4-hour chart, price movement continues its downtrend. Here, bears have maintained downward momentum for the past two sessions. Price action remains below all the MA lines.
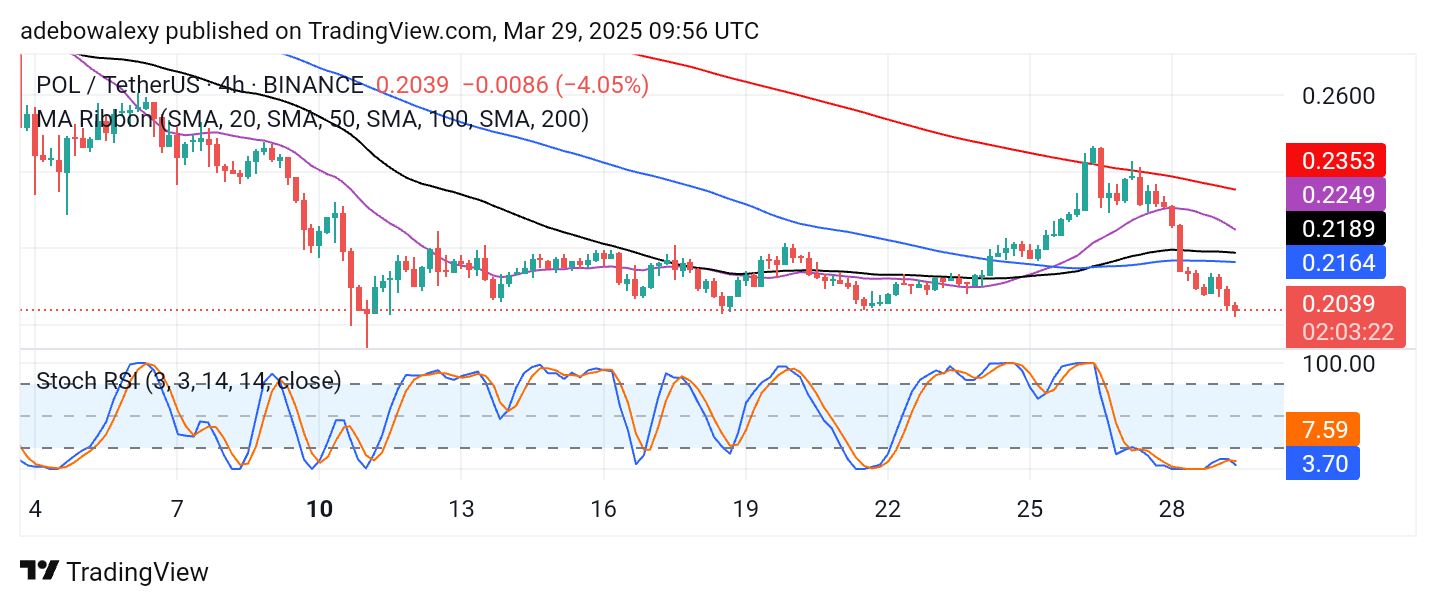
However, the last price candle on this chart shows a lower shadow, suggesting that upward forces are in action. Additionally, the Stochastic RSI lines have formed an upward crossover while already in the oversold region. This suggests that while price action retains bearish potential, a rebound may occur at the $0.2000 price level.
Get POL (ex-MATIC) here. Buy POL