Litecoin (LTC/USD) Price Hovers Closer to the $100 Support
Estimated Reading Time: 3 minutes
Don’t invest unless you’re prepared to lose all the money you invest. This is a high-risk investment and you are unlikely to be protected if something goes wrong. Take 2 minutes to learn more


Free Crypto Signals Channel
Litecoin Price Prediction – April 26
The LTC/USD market operation presently shows the crypto-economic price hovers closer to the $100 line. Trading spots have recorded a high of $105 and a low of $103, keeping a minute percentage of 0.15.
LTC/USD Market
Key Levels:
Resistance levels: $120, $130, $140
Support levels: $100, $90, $80
LTC/USD – Daily Chart
The LTC/USD daily chart reveals the crypto-economic price hovers closer to the $100 support level. Over time, observantly, the trade succumbs to a fearful falling force when it reaches a high resistance zone around the SMA trend lines. The 14-day SMA indicator is above the 50-day SMA indicator. Candlesticks representing the true-trading situation are in the descending triangular shape. The Stochastic Oscillators are southbound, positioned close to the range of 20.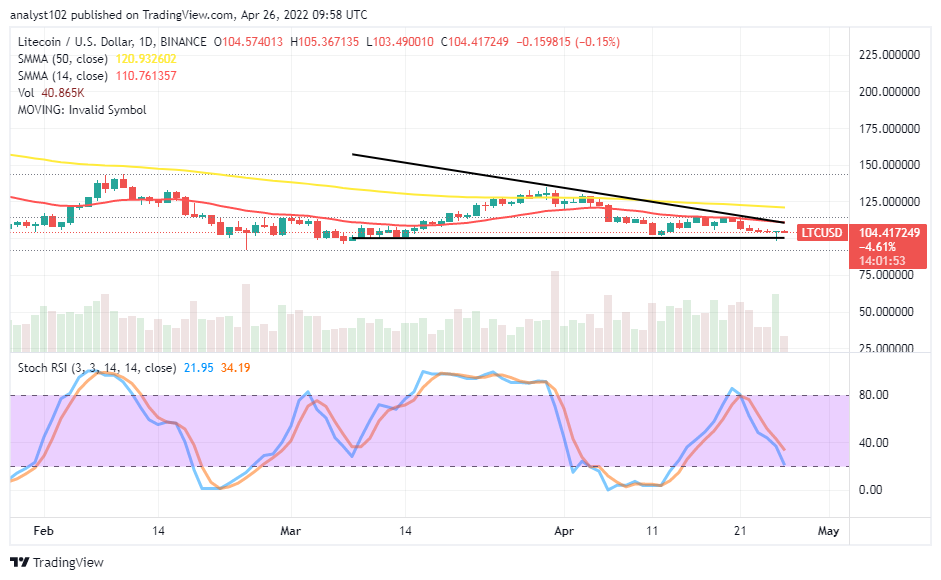
What is the trading like as the LTC/USD market price hovers closer to the $100 support?
The LTC/USD market trading outlook still relatively wallows in depression as the crypto-economic price hovers closer to the $100 support level in a descending triangular pattern. A downward force may have to play around the value-line for a while to find a firm baseline to allow variant swing-highs afterward. It will only require long-position players to watch for a reliable bounce-off before going for a long order.
On the downside of the technical analysis, the LTC/USD market attempts to slow down efforts to push prices southward. Hence the reason for having lower lows closely above the $100 trading zone. A breakdown at the value line could result in a complete process for the downing force. Based on that assumption, it won’t technically sound safe to follow the move to the downside to avoiding unnecessary bears’ trap in no time.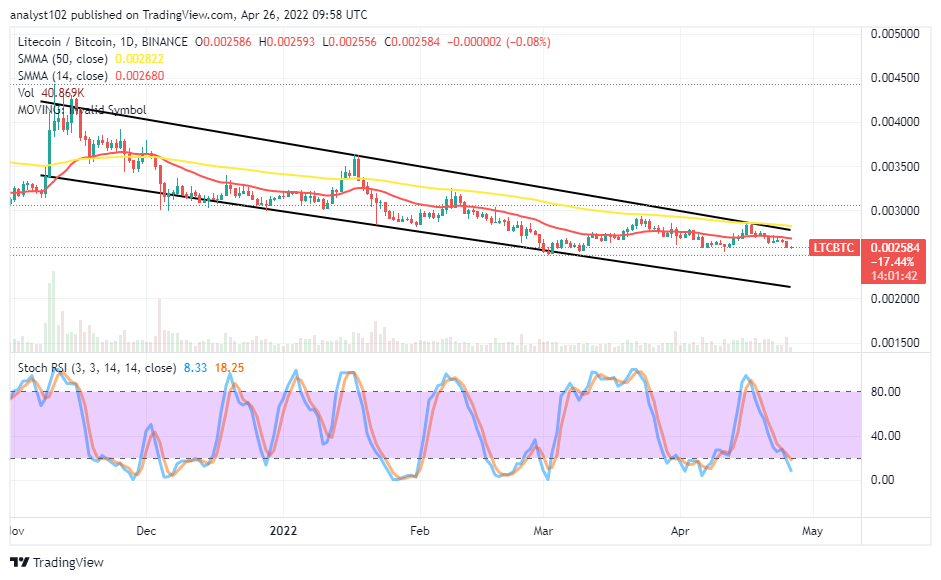 LTC/BTC Price Analysis
In comparison, Litecoin runs within the bearish path, trending with Bitcoin. The cryptocurrency pair price trades underneath the trend lines of the SMAs. The 50-day SMA indicator is above the 14-day SMA indicator. The Stochastic Oscillators are in the oversold region, facing the south direction to indicate the base crypto is still somewhat facing a downward trending pressure against the countering crypto.
.
Note: Cryptosignals.org is not a financial advisor. Do your research before investing your funds in any financial asset or presented product or event. We are not responsible for your investing results.
You can purchase Lucky Block here. Buy LBlock: