Wall Street Memes (WSM/USD) Price Steady, Builds on Uptrend
Estimated Reading Time: 3 minutes
Don’t invest unless you’re prepared to lose all the money you invest. This is a high-risk investment and you are unlikely to be protected if something goes wrong. Take 2 minutes to learn more

Wall Street Memes Price Prediction – July 19
Following the trade conditions that triggered a notable upsurge in the market value of the Wall Street Memes coin against the US dollar, the situation has now shifted into a slight pullback phase, showing signs of a potential reversal, as the underlying instrument remains steady and continues to build on its upward trajectory.
With a series of bearish candlesticks emerging in the WSM/USD market, the lower trade region around $0.0007 is expected to offer strong support, while the middle Bollinger Band appears to serve as a key technical indicator reinforcing the likelihood of a price defense at that level.
WSM/USD Market
Key Levels
Resistance levels: $0.0009, $0.001, $0.0011
Support levels: $0.0006, $0.0005, $0.0004
WSM/USD – 4-Hour Chart
The WSM/USD 4-hour chart showcases that the crypto-economic trade is steady and builds on an uptrend outlook.
The stochastic oscillators have shifted downward, aligning below key signal lines near the 20-level threshold, indicating oversold conditions that may require a reset phase before any sustainable bullish rebound can develop. Concurrently, the Bollinger Bands are beginning to contract amid a cluster of selling candlesticks, signaling growing downside pressure and warranting caution against initiating fresh short-term positions.
Will WSM/USD Retrace to Recent Lows per Technical Oscillators’ Current Configuration?
Current technical oscillators suggest potential downside, but oversold signals portend caution against shorting bias, given that the WSM/USD market is steady, building on uptrend settings.
Despite a combined 25% leaning toward downside or neutral scenarios, the prevailing 75% outlook remains bullish, backed by strong underlying momentum and consistent higher lows. Any short-term pullbacks or sideways movements to the $0.0007 level are more likely healthy pauses within a broader uptrend. These market behaviors typically reflect strength-building phases before further bullish continuation, rather than trend reversals.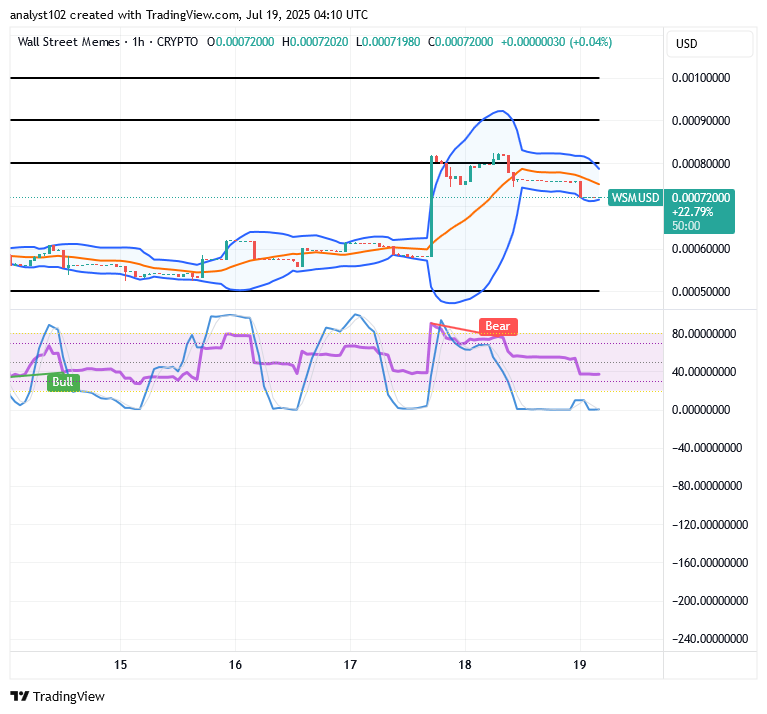
WSM/USD 1-Hour Chart
The WSM/USD market’s 1-hour chart demonstrates that the crypto-economic business is steady, building on an uptrend positioning sentiment.
At the current hourly chart configuration, the stochastic oscillators are aligning for a potential bullish flag formation, blowing hot and cold within the defined consolidation range between the $0.0008 and $0.0007 thresholds, indicative of a preparatory phase for an upward continuation. Having recently swung into the oversold region, the oscillators are indicating a potential shift in momentum, suggesting that further sustained downside movement is increasingly unlikely in the long run. This setup implies that bullish recovery attempts may soon gain traction.
$WSM / $USDT is now officially tradeable on #Bybit Perpetuals with enhanced liquidity.
Trade here: https://i.bybit.com/1Wab4K3z
$WSM community, we saw your Tweets! 👏$WSM / $USDT is now tradeable on #Bybit Perpetuals.
— Bybit (@Bybit_Official) October 13, 2023
Trade here: https://t.co/le4XyVyXaZ
Also want your project listed? Share your suggestions here:https://t.co/W7EWJVVNV5 https://t.co/XgXoL7g0rF