Wall Street Memes (WSM/USD) Price Holds, Keeps Rising Path
Estimated Reading Time: 4 minutes
Don’t invest unless you’re prepared to lose all the money you invest. This is a high-risk investment and you are unlikely to be protected if something goes wrong. Take 2 minutes to learn more
Wall Street Memes Price Prediction – July 18
WSM/USD’s long-term holders continue to demonstrate confident positioning, with recent price action advancing beyond the key $0.0006 trade line, which has effectively allowed the crypto-based instrument to hold steadily while keeping a rising path.
This upward progression signals renewed bullish strength and growing market conviction, suggesting that momentum is building toward establishing a firmer uptrend above previous consolidation levels. As the WSM/USD pair builds on its breakout momentum, the alignment of indicators supports the case for sustained upward traction.
WSM/USD Market
Key Levels
Resistance levels: $0.0009, $0.001, $0.0011
Support levels: $0.0006, $0.0005, $0.0004
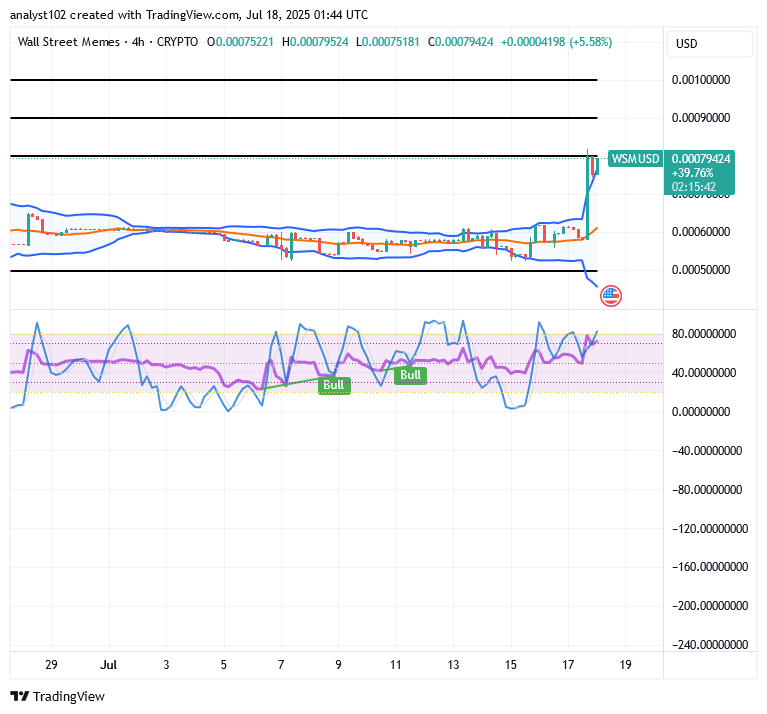
WSM/USD – 4-Hour Chart
The WSM/USD 4-hour chart pictures it that the pairing market is holding firmly to the upside, as the price keeps a rising path.
The Bollinger Bands are undergoing a pronounced expansion on the upper end, reflecting heightened volatility and aligning with intensifying bullish pressure as the market advances toward a parabolic trajectory. Simultaneously, the stochastic oscillators display a steep upward inflection, decisively entering overbought territory—an indication of accelerating upside momentum and increasing demand concentration across multiple technical dimensions.
Has There Been a Measurable Retardation That Could Cause the WSM/USD Market to Lose Momentum at $0.0008?
The WSM/USD market will maintain its upside trajectory beyond the $0.0008 level, driven by sustained bullish momentum, rising volume patterns, and firm positioning above key support zones, given that the crypto market is presently holding strongly, keeping a rising path alongside the upper Bollinger Band indicator.
Roughly 15% of the outlook may favor a downside scenario, which could occur if external shocks or sudden shifts in sentiment trigger profit-taking or temporary pullbacks. However, such moves are likely to be shallow and short-lived given the underlying strength.
The remaining 10% suggests a neutral stance, where the market may consolidate sideways around $0.0008 before choosing its next directional breakout.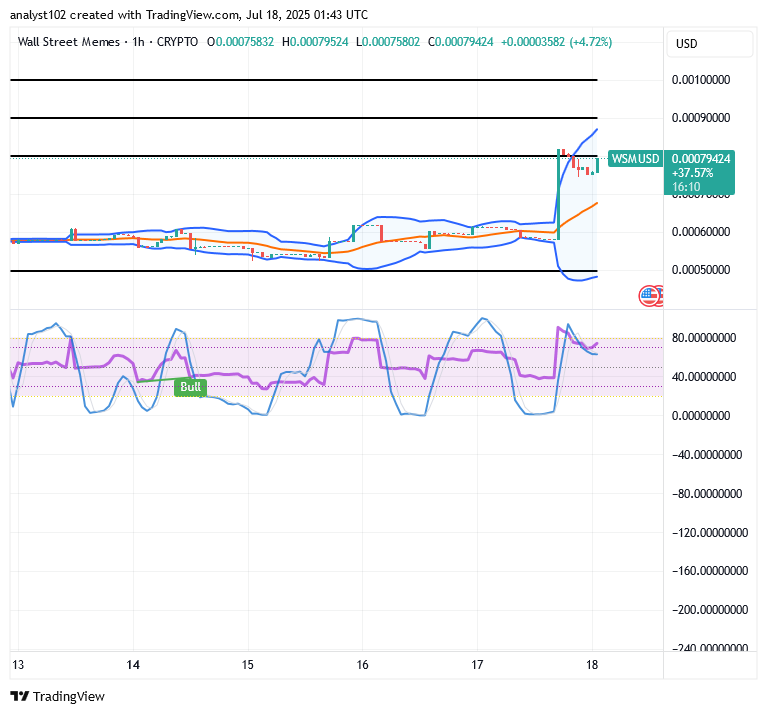
WSM/USD 1-Hour Chart
The WSM/USD market’s 1-hour chart showcases that the crypto-economic trade is holding firmly to the upside, as the price keeps a rising path.
Comparable conditions are unfolding concurrently, driving the indicators to shift decisively upward. The stochastic oscillators have surged into the overbought zone, maintaining a pronounced upward curvature as they stabilize—poised for a potential directional breakout amid intensifying momentum buildup. Similarly, the Bollinger Bands are extending outward on the upper side, signaling an expansion in bullish pressure and reinforcing the probability of sustained upward price action.
Over the past 24 hours, the $WSM token and its community experienced a coordinated cyberattack, primarily targeting our official Discord channel in an attempt to disrupt operations and compromise communication integrity.
Over the last 24 hours, The $WSM token and community has undergone a coordinated attack. The hackers specifically targeted our Discord community.
— Wall Street Memes (@wallstmemes) October 12, 2023
We reiterate that no one from the Wall St Memes team will ever direct message you first, or ask for any personal information – even… pic.twitter.com/VwySpXC7cz