Wall Street Memes (WSM/USD) Price Drifts, Retains Climb Mode
Estimated Reading Time: 4 minutes
Don’t invest unless you’re prepared to lose all the money you invest. This is a high-risk investment and you are unlikely to be protected if something goes wrong. Take 2 minutes to learn more
Wall Street Memes Price Prediction – July 17
A slight level of inactiveness has been relatively observed in the way WSM/USD long-term position holders have made their presence felt against most probable downward pulls, as the crypto-economic price notably drifts and maintains a climbing mode around the major trade line of $0.0006, pushing gradually back to the upside.
A consistent formation of upward-leaning candlesticks highlights a reinforcing bullish structure, suggesting that WSM/USD market participants are gradually positioning for a potential breakout. This persistent build-up reflects growing confidence among buyers, setting the stage for renewed upside movement.
WSM/USD Market
Key Levels
Resistance levels: $0.0007, $0.0008, $0.0009
Support levels: $0.0005, $0.0004, $0.0003
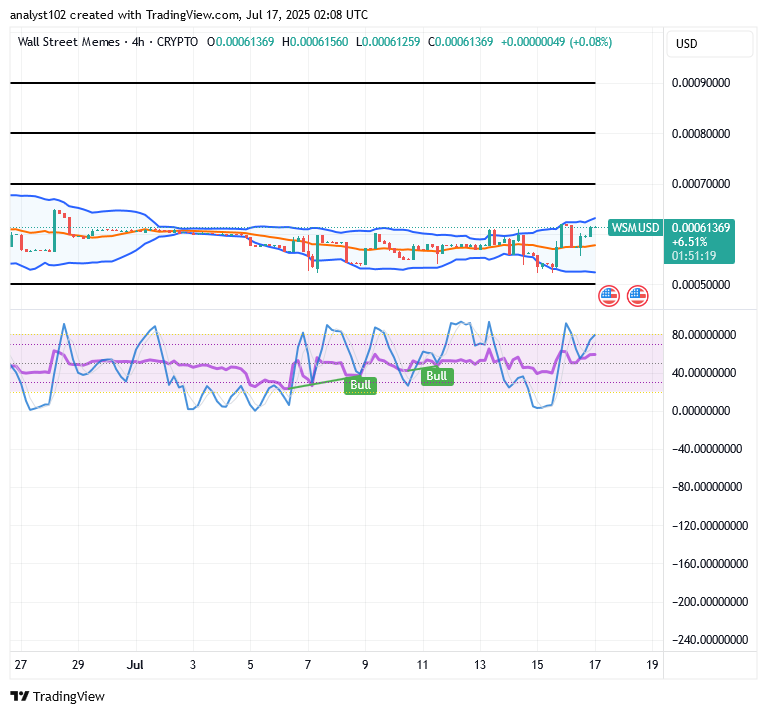
WSM/USD – 4-Hour Chart
The WSM/USD 4-hour chart mirrors that the crypto-economic business drifts, retains climb mode around the upper Bollinger Band indicator.
The stochastic oscillators are exhibiting a sharp upward inflection, crossing into elevated levels that signal strengthening bullish momentum and growing demand across multiple technical layers. In parallel, the Bollinger Bands have contracted tightly near the upper boundary, indicating reduced volatility and the potential for an imminent breakout. Should a bullish candlestick emerge with sufficient confirmation, it may catalyze a sustained upside sequence, clearing layered resistance levels and supporting an extended northbound trajectory.
Should WSM/USD Holders Liquidate Near $0.0006 Amid Sustained Long-Term Accumulation and Breakout Prospects?
Liquidating positions around the $0.0006 trade line would likely mean selling the base instrument prematurely—ahead of the long-anticipated potential rebounds—given that the WSM/USD market continues to drift upward, maintaining a climbing mode across most moving average structures.
Short-term traders may continue executing tactical entries near the lower boundary of the Bollinger Bands, capitalizing on localized pullbacks within the volatility range.
With disciplined position management, they can optimize quick exit points while still benefiting from the broader bullish undertone currently supporting price movements.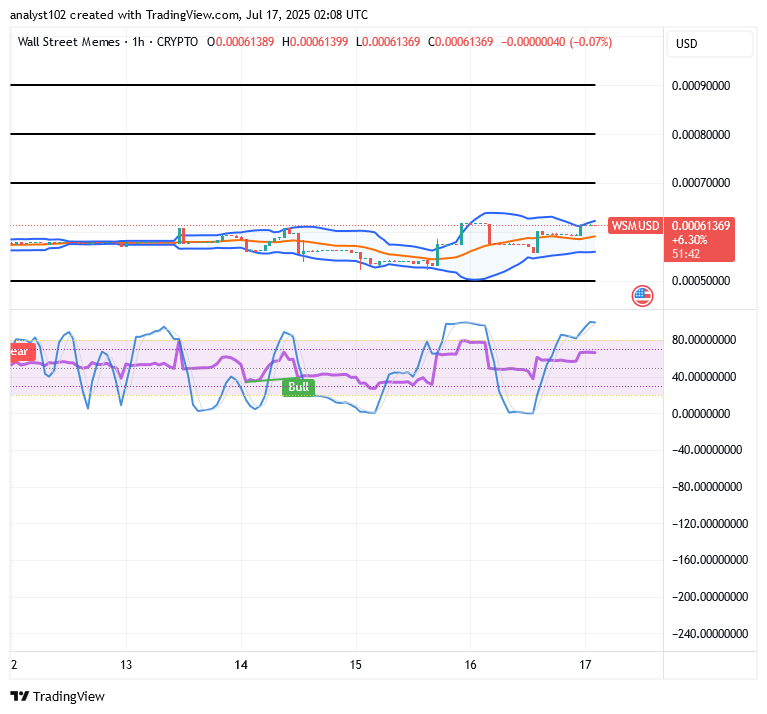
WSM/USD 1-Hour Chart
The WSM/USD market’s 1-hour chart showcases that the crypto-economic price is drifting to retain climb mode around the upper Bollinger Band indicator, like a wise medium-term setup.
The stochastic oscillators have surged into the overbought zone, exhibiting strong upward curvature as they consolidate in anticipation of a potential directional breakout under intensified momentum buildup. Simultaneously, the Bollinger Bands are exhibiting an upward extension, signaling expanding bullish pressure. The emergence of smaller-bodied candlesticks near the upper band reflects reduced intraday volatility and supports the case for a continuation of the prevailing upward trend.
Dive into new trading opportunities with 1–25x leverage. Plus, they’re now available on Bybit Futures Grid Bot with automated precision and risk-adjusted strategies! Start trading now.
BIGTIME: i.bybit.com/20rabgrK
WSM: i.bybit.com/ab1F9gWH
🚀 BIGTIMEUSDT & WSMUSDT Contracts now on Bybit!
— Bybit (@Bybit_Official) October 12, 2023
Dive into new trading opportunities with 1-25x leverage. Plus, they’re now on Bybit Futures Grid Bot! Start trading now.
📈 BIGTIME: https://t.co/FAQlbhnzAh
📈 WSM: https://t.co/pb2y2AfMBE#CryptoTrading #Bybit