Wall Street Memes (WSM/USD) Price Shows Up, Keeps Jerking
Estimated Reading Time: 4 minutes
Don’t invest unless you’re prepared to lose all the money you invest. This is a high-risk investment and you are unlikely to be protected if something goes wrong. Take 2 minutes to learn more
Wall Street Memes Price Prediction – July 16
Today’s business operations matching Wall Street Memes coin’s trade worth with the power of purchasing of the US currency have been visibly gaining momentum, given that the crypto-economic price shows up and keeps jerking around the trade line of $0.0006.
As indicated on the WSM/USD trade chart, a systemic formation of candlesticks has been consistently emerging, reinforcing the potential to secure structurally stable upward moves, possibly extending into a long-term bullish trajectory. Based on this sentiment, position staking should continue strategically, regardless of any intermittent corrective moves that may still pave the way for temporary downside retracements within the broader accumulation phase.
WSM/USD Market
Key Levels
Resistance levels: $0.0007, $0.0008, $0.0009
Support levels: $0.0005, $0.0004, $0.0003
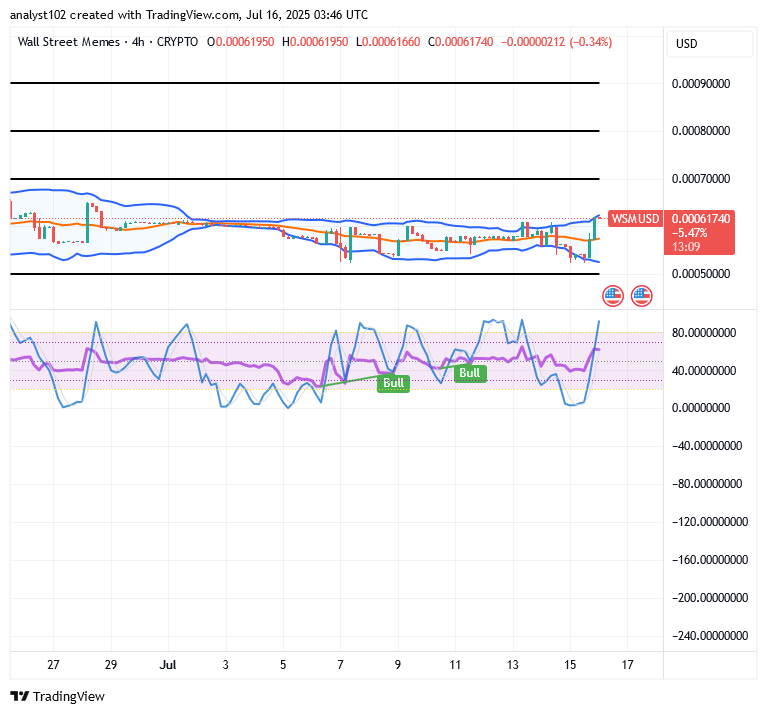
WSM/USD – 4-Hour Chart
The WSM/USD 4-hour chart showcases that the crypto-economic market is heading upside and keeps jerking in its output.
The Bollinger Bands are exhibiting a tactically compressed configuration near the upper threshold, highlighting a critical resistance zone where the formation of a decisive bullish candlestick is required to reinforce upward momentum and establish structural barriers favoring further gains. Meanwhile, the stochastic oscillators have pivoted sharply northward, partially breaching the overbought zone—signaling intensified bullish activity as buyers attempt to reassert control across multiple trading layers.
Is It Technically Justifiable for WSM/USD Market Participants to Realize Gains Around the $0.0006 Level?
Short-term traders who might have opened positions earlier on around the lower Bollinger Band indicator closely toward the support point of $0.0005 might ideally cash out some positions in profits, as the WSM/USD trade shows up and keeps jerking positively in its moving style.
Despite the emergence of bullish cues, WSM/USD is still in the early phase of structural recovery, with technical indicators suggesting a gradually forming base rather than a confirmed breakout. Premature profit-taking at this stage could undermine positional advantages, especially as fading bearish pressure and steady accumulation point toward a deeper market transition. With momentum gradually shifting and confirmation signals still crystallizing, long-term holders are better positioned to benefit by sustaining exposure in alignment with the broader upside development.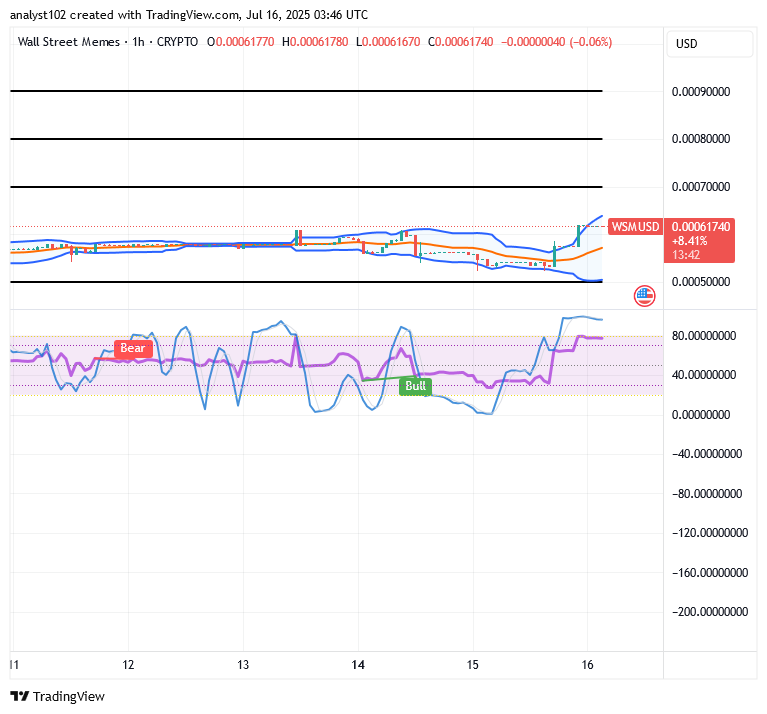
WSM/USD 1-Hour Chart
The WSM/USD market’s 1-hour chart reveals that the crypto-economic trade shows up and keeps jerking pushes intact.
The stochastic oscillators have traveled northbound into the overbought region, swinging higher in a preparatory mood of awaiting the next defined direction amid rising momentum pressure. The Bollinger Bands are stretched northward, indicating that buying moves are on the rise with smaller candlesticks in the formation, reflecting compressed volatility and upward bias continuation.
$WSM / $USDT is now officially tradeable on #Bybit Perpetuals.
$WSM community, we saw your Tweets! 👏$WSM / $USDT is now tradeable on #Bybit Perpetuals.
— Bybit (@Bybit_Official) October 13, 2023
Trade here: https://t.co/le4XyVyXaZ
Also want your project listed? Share your suggestions here:https://t.co/W7EWJVVNV5 https://t.co/XgXoL7g0rF