Wall Street Memes (WSM/USD) Trade Steps On, Bouncing About
Estimated Reading Time: 4 minutes
Don’t invest unless you’re prepared to lose all the money you invest. This is a high-risk investment and you are unlikely to be protected if something goes wrong. Take 2 minutes to learn more

Wall Street Memes Price Prediction – July 15
Gradually, stable price actions have been produced at various significant lower levels, which may lead to unprecedented rebounding forces that could counteract the bearish impacts against the bullish attempts in the Wall Street Memes coin compared to the valuation of the US dollar, given that the economic situation indicates that the price steps on, bouncing about for a substantial bounce-off.
The WSM/USD setup shows early signs of technical strength, supported by easing volatility and emerging patterns. While bullish prospects are forming, downside risk remains fluid, cautioning against overconfidence in stable draw-downs. Accumulation may be considered, but with guarded positioning—especially if the investor intends a short-term approach.
WSM/USD Market
Key Levels
Resistance levels: $0.0007, $0.0008, $0.0009
Support levels: $0.0005, $0.0004, $0.0003
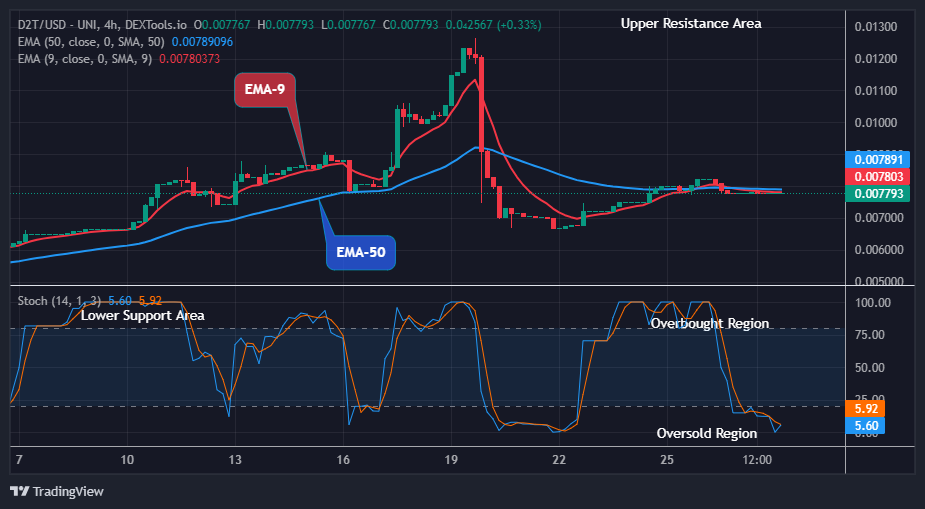
WSM/USD – 4-Hour Chart
The WSM/USD 4-hour chart demonstrates that the crypto-economic trade steps on, bouncing about in preparation for a sudden potential breakout.
The stochastic oscillators are positioned southbound in the oversold region, raising a signal note against fostering formidable shorting moves in the setup, as weakening momentum resists deeper downside traction. The Bollinger Bands indicators are having a sizeable bearish candlestick at the lower side, portending the possibility of ending the moves steadily in the negative direction, unless volatility compression triggers a reversal spark.
Should WSM/USD Investors Stay Forward-Focused and Dismiss Hesitation as Rebound Cues Start Solidifying?
Early rebound signals and structural support justify forward-focused strategies, as lingering hesitation may hinder timely entries into potential recovery-driven accumulation zones, given that the WSM/USD price steps on, bouncing about in its inputting pattern.
WSM/USD is beginning to establish a technical base, as buyers gradually reclaim ground from lower zones amid fading bearish pressure and steady accumulation. Although bullish signals are emerging, definitive confirmation is still forming. Given the improving structure, long-term participants may find it reasonable to maintain their positions, aligning with the potential for a broader recovery while staying responsive to evolving momentum.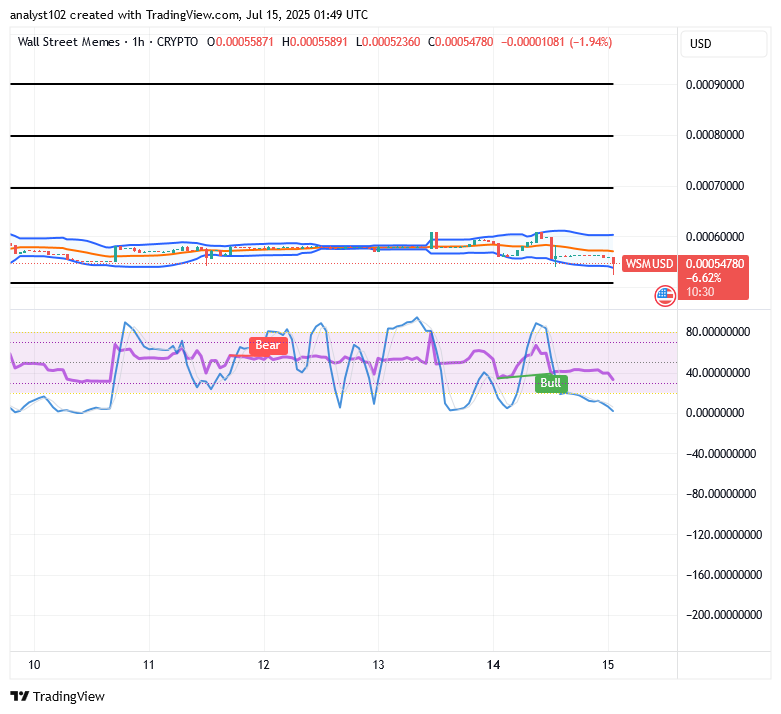
WSM/USD 1-Hour Chart
The WSM/USD market’s 1-hour chart showcases that the crypto-economic market steps on, bouncing about.
The Bollinger Bands are undergoing progressive expansion, signaling rising volatility and the emergence of broader trade zones conducive to identifying viable long-entry opportunities. Concurrently, the stochastic oscillators reflect persistent bullish attempts to initiate technical rebounds, despite operating within the context of an overarching bearish framework.
BIGTIMEUSDT & WSMUSDT Perpetual Contracts Now Live on Bybit—Enabling Leverage, Scalability, Liquidity Access, and Strategic Positioning!
🚀 BIGTIMEUSDT & WSMUSDT Contracts now on Bybit!
— Bybit (@Bybit_Official) October 12, 2023
Dive into new trading opportunities with 1-25x leverage. Plus, they’re now on Bybit Futures Grid Bot! Start trading now.
📈 BIGTIME: https://t.co/FAQlbhnzAh
📈 WSM: https://t.co/pb2y2AfMBE#CryptoTrading #Bybit