Wall Street Memes (WSM/USD) Price Wags About, Shows Steadily
Estimated Reading Time: 3 minutes
Don’t invest unless you’re prepared to lose all the money you invest. This is a high-risk investment and you are unlikely to be protected if something goes wrong. Take 2 minutes to learn more

Wall Street Memes Price Prediction – July 14
Despite the fact that the trading situation in the market operations puts the valuation of the Wall Street Memes against the purchasing power of the American currency, the obtainable market stance yet portends that the price wags about, showing momentum capable of generating a quick spike.
The WSM/USD market structure is rotating into a technically constructive posture, supported by the confluence of maturing momentum dynamics, controlled volatility compression, and emergent chart patterns. While the formation of a sustained upside trajectory remains in progress, prevailing indicators continue to favor accumulation strategies for long-term participants. The lower Bollinger Band has acted as a resilient dynamic floor, absorbing downside pressure and validating the market’s underlying bid tone. These developments collectively enhance the probability of a directional breakout, suggesting that long-horizon positioning may benefit from current structural firmness.
WSM/USD Market
Key Levels
Resistance levels: $0.0007, $0.0008, $0.0009
Support levels: $0.0005, $0.0004, $0.0003
WSM/USD – 4-Hour Chart
The WSM/USD 4-hour chart reveals that the crypto-economic trade wags about, showing momentum to potentially enter an accelerated bullish phase.
Varying candlestick sizes have consistently engaged with the Bollinger Bands, reinforcing the $0.0006 level as a key resistance zone within the current crypto-economic structure. Meanwhile, the stochastic oscillators have maintained a steady upward curvature, remaining anchored within bullish territory over several sessions.
Should WSM/USD investors downplay sustained decline risks as rebound signals begin to emerge?
Being as it is, it is practically becoming more glaring that the WSM/USD market investors are getting recomposed by making a steady comeback, given that the crypto-economic market wags about, showing momentum in the pricing proceedings.
WSM/USD is showing early signs of base-building, with mild accumulation and easing bearish pressure. Technical indicators suggest a possible bullish tilt, though confirmation remains limited. Current consolidation may evolve constructively, but caution is still warranted. Longer-horizon participants might consider staying engaged while remaining flexible to shifting momentum.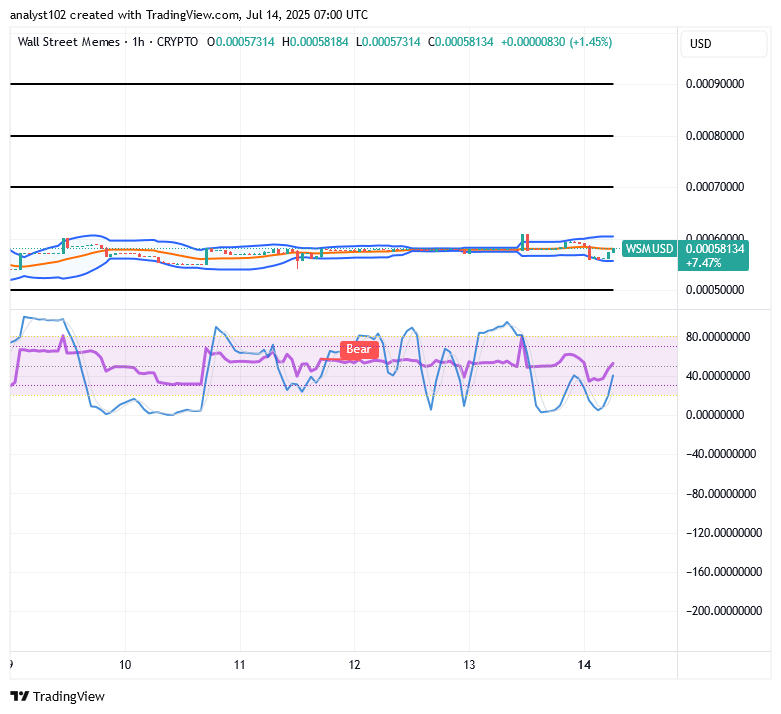
WSM/USD 1-Hour Chart
The WSM/USD market’s 1-hour chart reveals that the crypto-economic trade wags about, showing momentum in its output.
The stochastic oscillators are presently demonstrating that bulls have been actively trying to make a series of technical rebounds under a broader bearish setup. Meanwhile, the Bollinger Bands are in a state of gradually opening wider, clearly showcasing the evolving trade zones for securing potentially decent long-position entry orders.
To participate further, you can stake your WSM tokens here or purchase directly from the official site.
🔥 Up To 43% APY Now Available 🔥
— Wall Street Memes (@wallstmemes) October 8, 2023
(at the time of posting)
Stake Now ➡️ https://t.co/X031FQo0bW Buy Now ➡️ https://t.co/6zkwWf1VRF pic.twitter.com/o9qrY1zJn8