Bitcoin (BTC/USD) Market Experiences a Sharp Drop
Estimated Reading Time: 3 minutes
Don’t invest unless you’re prepared to lose all the money you invest. This is a high-risk investment and you are unlikely to be protected if something goes wrong. Take 2 minutes to learn more
Bitcoin Price Prediction – November 9
There is a lessening of catalysts in the BTC/USD trade operation as the crypto market experiences a sharp drop when it couldn’t breach northward more from a point closely beneath the $22,500 resistance line. All figures carry negative signs at an average of1.88% minus as of the time of writing.
BTC/USD Market
Key Levels:
Resistance levels: $20,000, $22,500, $25,000
Support levels: $17,500, $15,000, $12,500
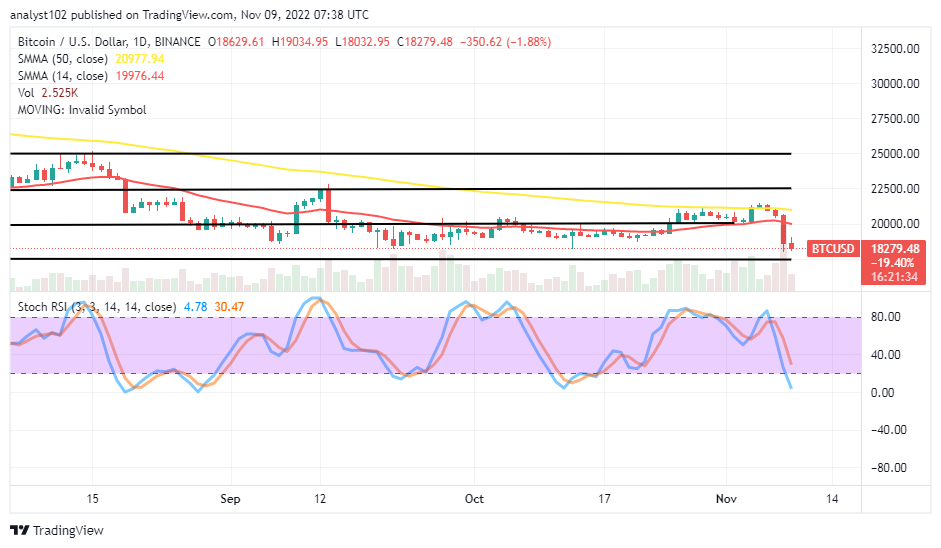
BTC/USD – Daily Chart
The daily chart depicts that the BTC/USD market experiences a sharp drop against the trend line of the smaller SMA during yesterday’s session. Two days before that significant decline, bearish candlesticks had occurred to attest to its eventual happenings. The 14-day SMA indicator is at $19,976.44, beneath the $20,977.94 value line of the 50-day SMA indicator. The Stochastic Oscillators have dipped into the oversold region, maintaining 30.47 and 4.78 levels. That shows some falling forces are relatively on course.
Has the BTC/USD market activity shown a signal that opposes the current downward trend?
There has been no tangible signal that contradicts the present downward trend in the BTC/USD trade operations as the crypto market experiences a sharp drop in its valuation from a point above the $20,000 trading zone that has been majorly in most of the trending pace. Going by the selling force, it appears that long-position placers will be settling for other rounds of rebuilding supports from a point around the $17,500 support trading level in the near time.
The downside of the BTC/USD technical analysis showcases that the current declining weight’s outlook portends that some pressures tend to play out for some time to the extent of trying to break down the $17,500 support level. However, it may as well not be the time to continue to launch new selling order positions around the value point. The moment a bullish candlestick forms might be the time bulls will be striving for a rebound.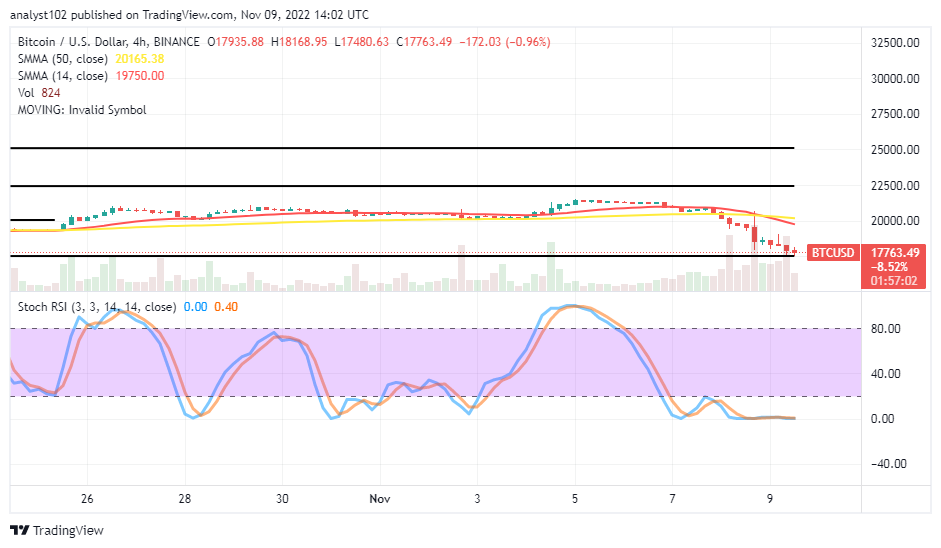
BTC/USD 4-hour Chart
The medium-term BTC/USD chart shows that different bearish trade candlesticks have been prominently crossing the SMAs’ trend lines down sharply toward a support level of $17,500. In a lesser comprehensible technical talk, the crypto market experiences a sharp drop in its market capitalization against the US Dollar. The 14-day SMA indicator has managed to cross the 50-day SMA indicator, which is at $20,165.38. And the smaller SMA is at $19,750.00 underneath it. The Stochastic Oscillators have conjoined their lines tightly in the oversold region, keeping 0.40 and 0.00 levels. That signifies any furthering of playing alongside a selling order is riskier than attempting to wait to join a rebounding motion that can emanate soon.
Note: Cryptosignals.org is not a financial advisor. Do your research before investing your funds in any financial asset or presented product or event. We are not responsible for your investing results.
You can purchase Lucky Block here. Buy LBLOCK