Bitcoin Price Prediction: BTC/USD Dips Below $29,600 Level
Estimated Reading Time: 3 minutes
Don’t invest unless you’re prepared to lose all the money you invest. This is a high-risk investment and you are unlikely to be protected if something goes wrong. Take 2 minutes to learn more
Bitcoin Price Prediction – July 31
The Bitcoin price is back under $26,500 after losing an important trend line that has supported the cryptocurrency’s uptrend.
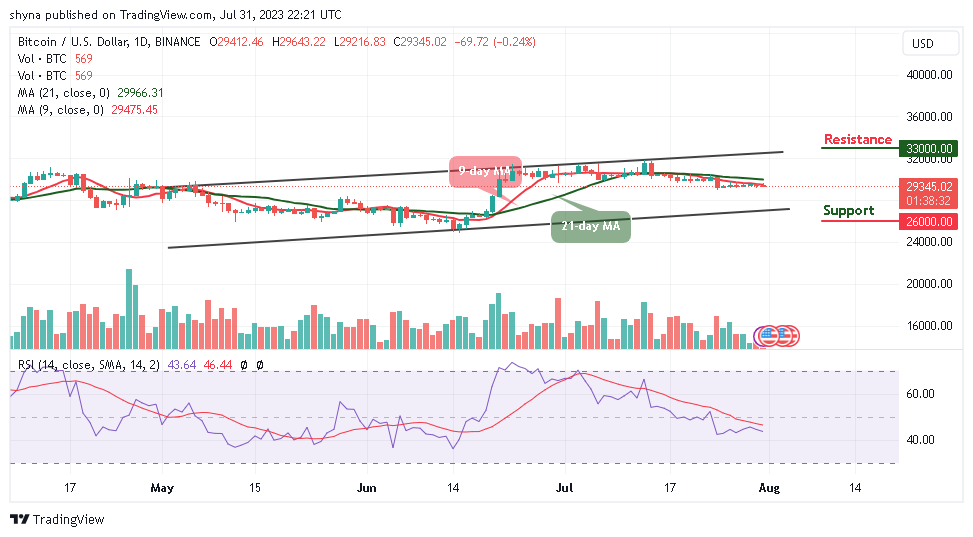
BTC/USD Long-term Trend: Bearish (Daily Chart)
Key levels:
Resistance Levels: $33,000, $34,000, $35,000
Support Levels: $26,000, $25,000, $24,000
After losing momentum above $29,600, BTC/USD is facing another decline as the coin remains below the 9-day moving average. The Bitcoin price is trading below the $29,400 level. However, the Resistance above $29,600 proves to be strong for bulls to break, as bears are now pushing the price per coin back down to retest support lower.
Bitcoin Price Prediction: Would Bitcoin Go Down?
Despite the risk of following a slight bearish movement, that doesn’t necessarily mean a downtrend will begin, or that the greater bull market is immediately over. The Bitcoin price may follow a sharper uptrend line at one point, and although the 9-day MA is still below the 21-day MA, therefore, no dramatic downside has ever materialized.
Moreover, if the bulls push the coin toward the upper boundary of the channel, the first level of resistance could be located at $30,000. A sustainable move above $31,000 is needed for the upside to gain traction, while the next important resistance may come at $32,000. Further resistance levels could be located around $33,000, $34,000, and $35,000 while the critical supports lie at $26,000, $25,000, and $24,000 as the technical indicator Relative Strength Index (14) moves below the 50-level.
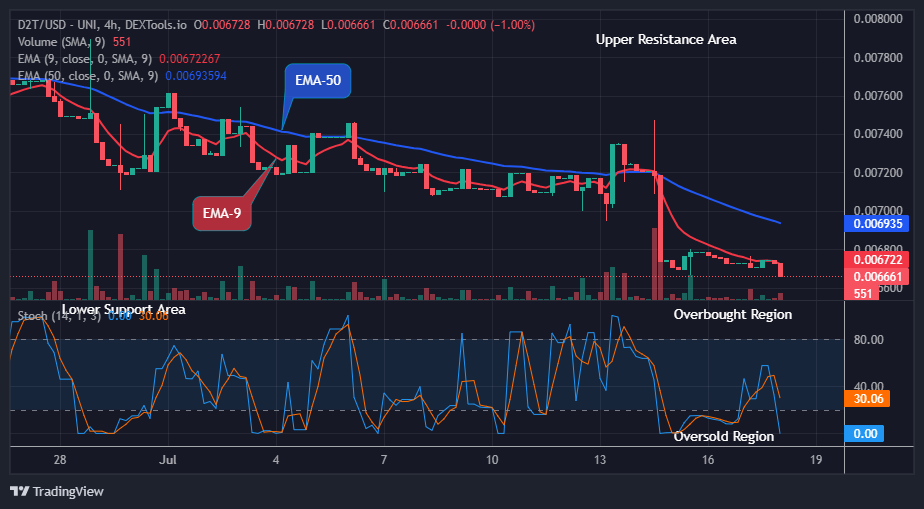
BTC/USD Medium-term Trend: Ranging (4H Chart)
Looking at the 4-hour chart, the bears are coming back into the market as the 9-day MA may cross below the 21-day MA. However, any bearish break below this crucial barrier causes the coin to plunge as low as $29,000. Meanwhile, unless the king coin recaptures $30,000 in the near term, the bears could have the upper hand over the bulls, and BTC/USD may soon reel significantly lower.

However, any further bearish movements could see the support level of $28,700 and below. Meanwhile, as the technical indicator, Relative Strength Index (14) moves to cross above the 50-level, a bullish cross above the upper boundary of the channel could hit the resistance level at $30,000 and above.
You can purchase Bitcoin here. Buy BTC