Ethereum (ETH/USD) Price Increases the Rallying Move
Estimated Reading Time: 3 minutes
Don’t invest unless you’re prepared to lose all the money you invest. This is a high-risk investment and you are unlikely to be protected if something goes wrong. Take 2 minutes to learn more

Free Crypto Signals Channel
Ethereum Price Prediction – March 28
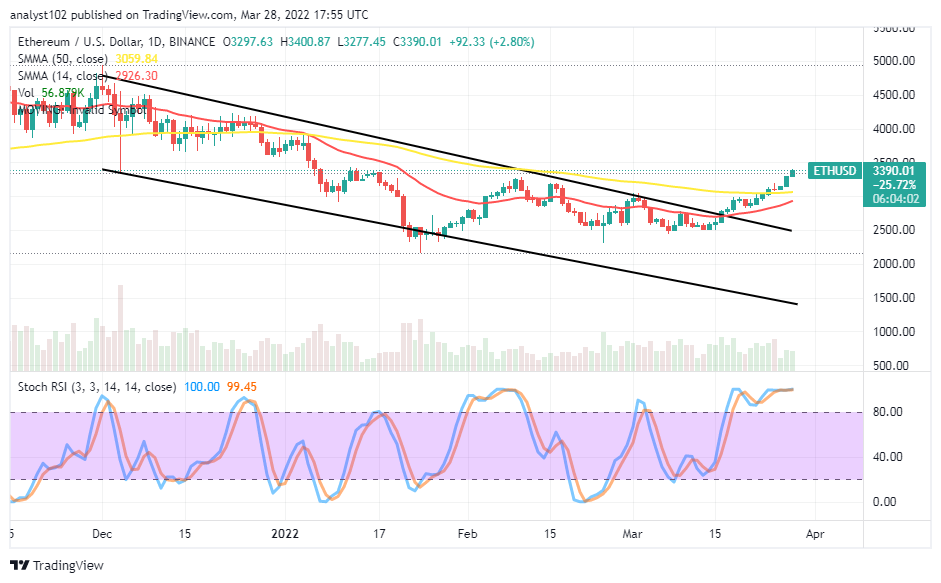
The ETH/USD price increases the rallying move to get more sustainable ups against the backdrop expectation that the crypto economy trades in an overbought region that should have been declining by now. Price is trading around $3,390 between the high and the low of $3,400 and $3,277 values at a percentage rate of 2.80 positives.
ETH/USD Market
Key Levels:
Resistance levels: $3,500, $3,750, $4,000
Support levels: $3,000, $2,750, $2,500
ETH/USD – Daily Chart
The ETH/USD daily chart showcases the crypto-economic price increases the rallying move above the trend line of the bigger SMA. The 50-day SMA indicator is above the 14-day SMA indicator, with a smaller space separating them. The Stochastic Oscillators are in the overbought region, moving in a consolidation manner. The trading situation shows that bullish forces are ongoing.
Should traders continue to ride alongside the upside trend as the ETH/USD price increases the rallying move?
The ETH/USD market operations hold firmly to the upside. fFesh long positions have to be placed under a precautionary mode despite the that bulls have been playing a dominance in the market at the expense of the US Dollar’s weaknesses. A slight pull-down will have to surface slightly against the high of the immediate last candlestick to observe the possibility of pushing more for-ups if that motion isn’t made to be prolonged to the downside.
On the downside of the technical analysis, the ETH/USD market short-position takers are to still wait for a bearish candlestick engulfing some of the past bullish candlesticks to be able to create a selling wall afterward. $3,500 and $3,750 may be the subsequently targeted resistance trading zones to markup the current upward trading motion. Anything different from that, either a pause or continual-smaller pushes to the up, will have to surface further.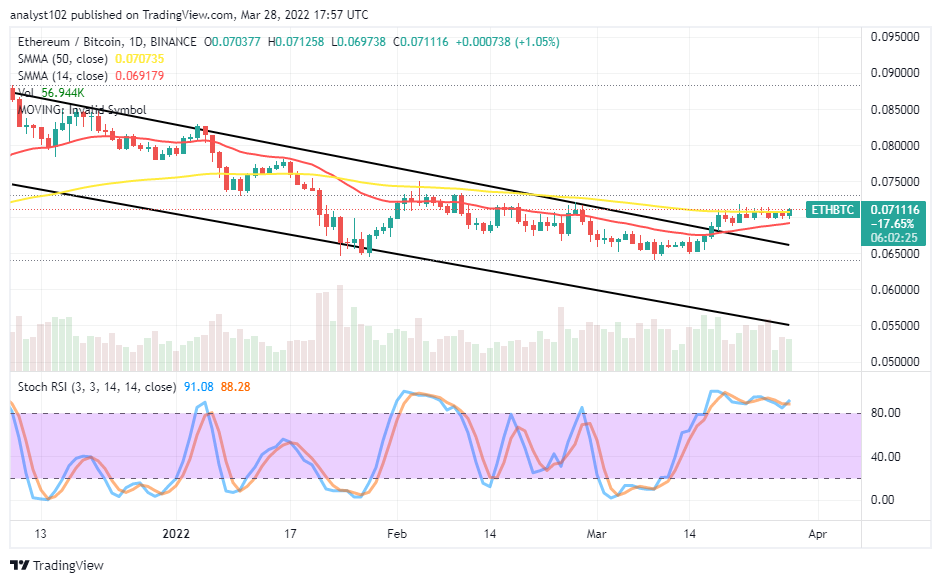
ETH/BTC Price Analysis
In comparison, Ethereum remains trying to strive toward the upside against Bitcoin. The cryptocurrency pair price increases range-moving manner around the trend line of the bigger SMA. The 50-day SMA indicator is above the 14-day SMA indicator. The Stochastic Oscillators are in the overbought region, moving in a consolidation manner to signify the base crypto has not dowsed its efforts at pushing against the counter-trading instrument.
Note: Cryptosignals.org is not a financial advisor. Do your research before investing your funds in any financial asset or presented product or event. We are not responsible for your investing results.
You can purchase Lucky Block here. Buy LBlock: