Quant Price Prediction: QNT/USD Ready for the North as Price Touches $110 Level
Estimated Reading Time: 2 minutes
Don’t invest unless you’re prepared to lose all the money you invest. This is a high-risk investment and you are unlikely to be protected if something goes wrong. Take 2 minutes to learn more
Quant Price Prediction – May 12
The Quant price prediction reveals that if bulls begin to increase their momentum, the price will head toward the upper boundary of the channel.
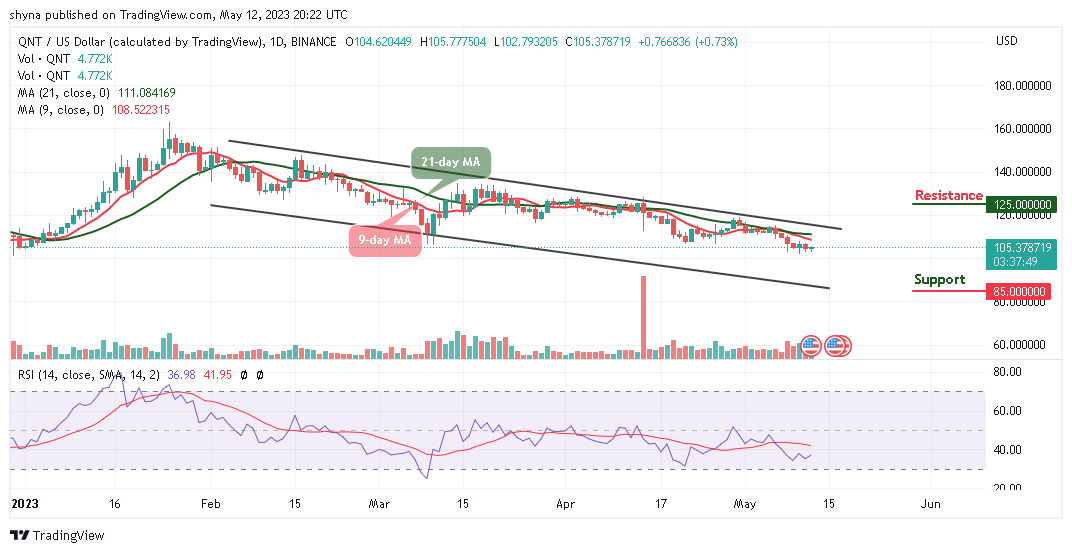
QNT/USD Medium-term Trend: Bearish (1D Chart)
Key Levels:
Resistance levels: $125, $135, $145
Support levels: $85, $75, $65
QNT/USD will begin to face the upside as the coin moves to cross above the 9-day and 21-day moving averages at the time of writing. Meanwhile, the bullish momentum will make the coin move toward the $110 resistance level but, if the bulls fail to drive the price to the upside, the Quant price could retreat before heading to the upside.
Quant Price Prediction: QNT/USD Prepares for the Bullish Movement
The Quant price is hovering at $105.3 where it could spike to the north. The Quant price will cross above the upper boundary of the channel so that it could locate the potential resistance levels at $125, $135, and $145. Meanwhile, if the coin decides to face the lower boundary of the channel, it can hit the support levels at $85, $75, and $65 for more buyers to come into the market while the technical indicator Relative Strength Index (14) moves below the 40-level.
QNT/USD Medium-term Trend: Ranging (4H Chart)
The Quant price is seen crossing above the 9-day and 21-day moving averages while the technical indicator Relative Strength Index (14) will cross above the 50-level. Meanwhile, any bullish movement toward the upper boundary of the channel can hit the resistance level of $115 and above.
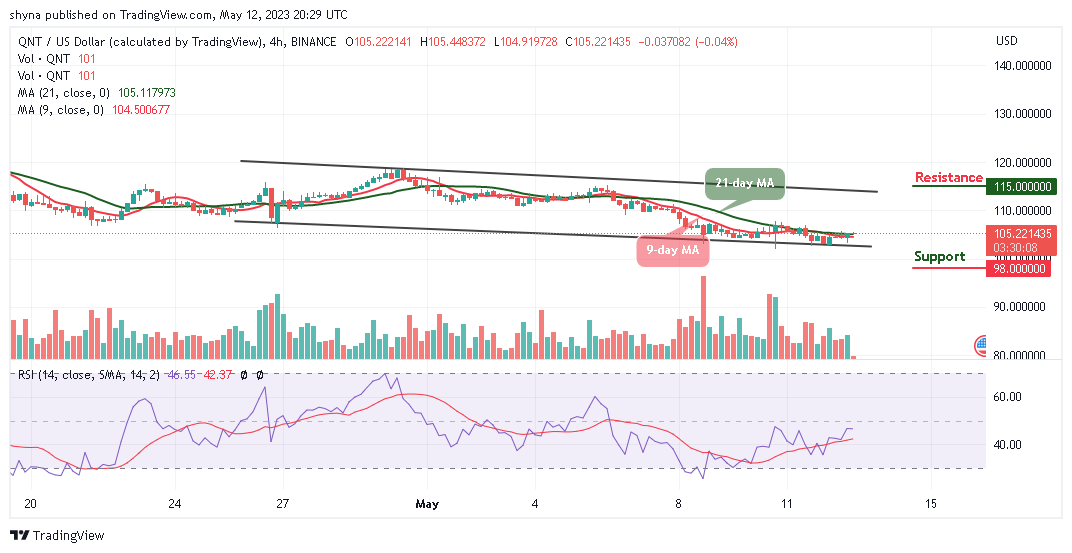
However, the Quant (QNT) can display a few bearish signals and the market price may continue to hover within the 9-day and 21-day moving averages where it can hit critical support at $98 and below. Notwithstanding the movement of the coin, the best time to buy is now as bulls prepare for the upside.
Place winning Quant trades with us. Get QNT here