Lucky Block Price Prediction: LBLOCK/USD Touches $0.000028 Low; Buy the Dip Now!
Estimated Reading Time: 3 minutes
Don’t invest unless you’re prepared to lose all the money you invest. This is a high-risk investment and you are unlikely to be protected if something goes wrong. Take 2 minutes to learn more
Lucky Block Price Prediction – December 2
The Lucky Block price prediction keeps sliding toward the moving averages; waiting for new buyers to come in before moving higher.
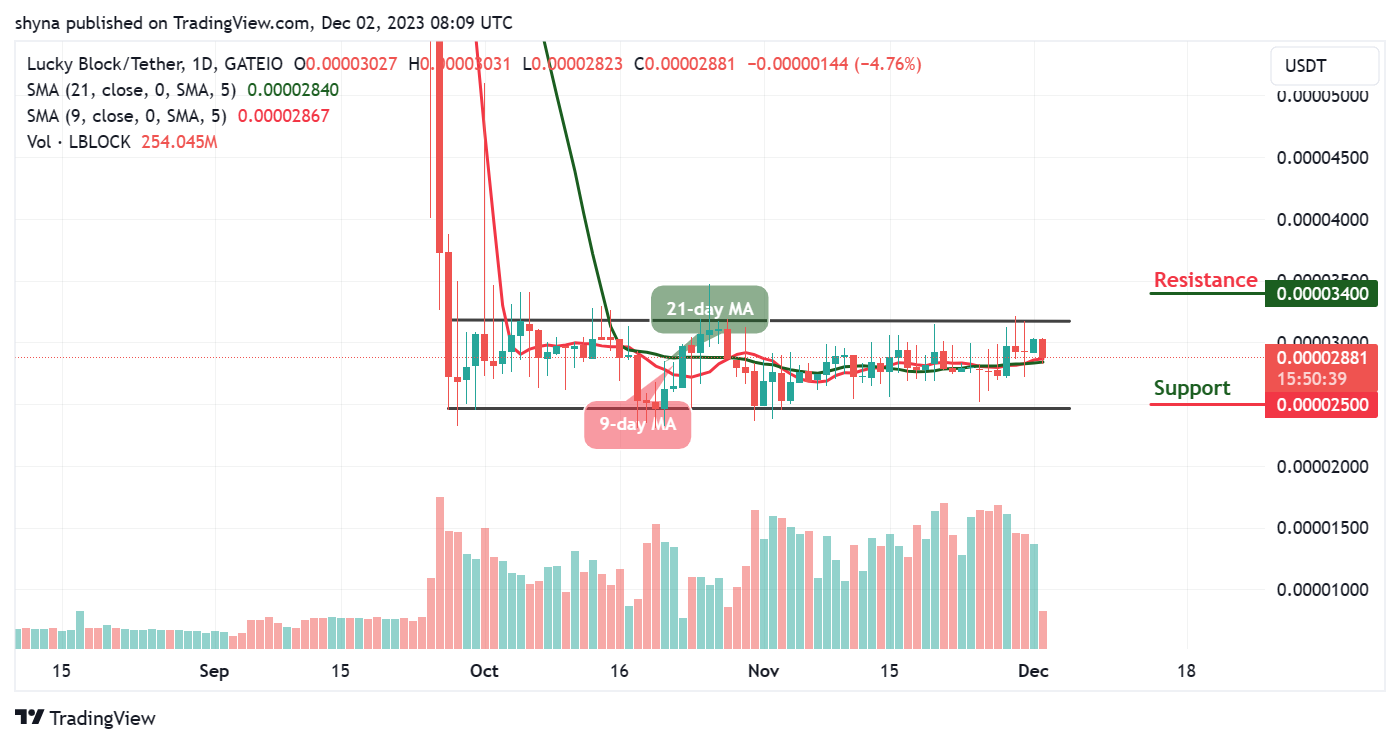
LBLOCK/USD Medium-term Trend: Ranging (1D Chart)
Key Levels:
Resistance levels: $0.000034, $0.000036, $0.000038
Support levels: $0.000025, $0.000023, $0.000021
LBLOCK/USD is poised for a bullish uptrend, gearing up for a surge towards the 9-day and 21-day moving averages. The ongoing movement is crucial for the coin’s ascent to the resistance level at $0.000032, anticipating an influx of new buyers into the market. However, in the event of a downturn initiated by sellers, there is a potential for the market to reach the support level of $0.000026.
Lucky Block Price Prediction: LBLOCK Could Retreat to Move Higher
The daily chart reveals that the Lucky Block price is currently situated around the 9-day and 21-day moving averages. Should the coin experience a further decline, it presents a favorable opportunity for existing investors to capitalize on the dip, while new buyers may consider entering the market. Notably, the 9-day MA maintains its position above the 21-day MA, but a sustained bearish trend could find support levels at $0.000025, $0.000023, and $0.000021.
On the other side, if buyers successfully maintain the current market value and propel the coin beyond the upper boundary of the channel, it could target the resistance level of $0.000033. A continuation of bullish momentum may encounter resistance at $0.000034, $0.000036, and $0.000038 respectively.
LBLOCK/USD Medium-term Trend: Ranging (4H Chart)
On the 4-hour chart, Lucky Block (LBLOCK) is exhibiting a ranging pattern as buyers gear up to enter the market, aiming to surpass both the 9-day and 21-day moving averages. If the bulls regain control, there’s a potential for LBLOCK/USD to reach the resistance level of $0.000030.
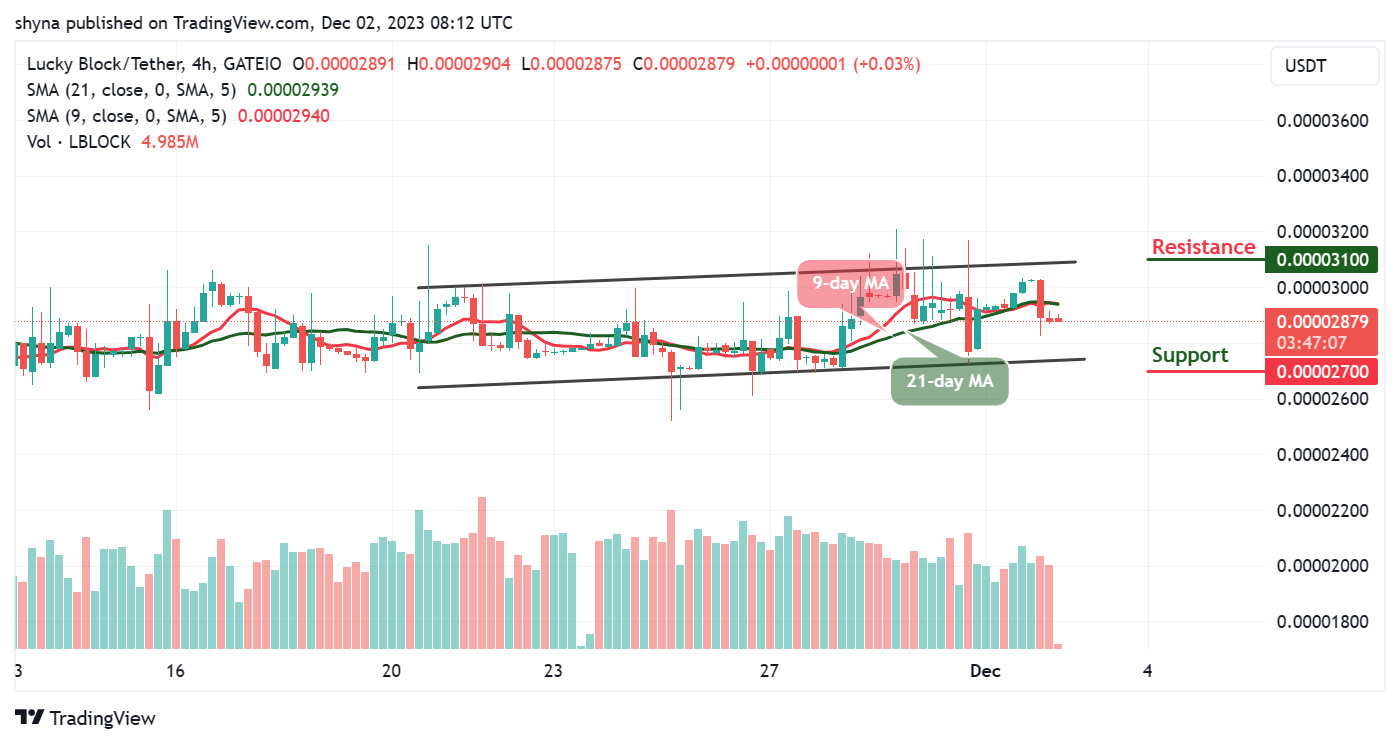
Furthermore, buyers are poised to drive the price above the moving averages, and additional resistance may be encountered around the upper boundary of the channel at $0.000031 and above. However, a bearish movement below the lower boundary of the channel could trigger support at $0.000027 and below, especially if the 9-day moving average undergoes a bearish cross below the 21-day moving average.
You can purchase Lucky Block here. Buy LBLOCK