Ethereum (ETH/USD) Price Trades Below the $2,000 Resistance
Estimated Reading Time: 3 minutes
Don’t invest unless you’re prepared to lose all the money you invest. This is a high-risk investment and you are unlikely to be protected if something goes wrong. Take 2 minutes to learn more

Free Crypto Signals Channel
Ethereum Price Prediction – May 30
After a chain of lower lows in the ETH/USD market operations, the crypto-economic price currently trades below the $2,000 resistance level. In the last couple of hours, the crypto economy trading between $1,914 and $1,802 value points at a 3.59% positive.
ETH/USD Market
Key Levels:
Resistance levels: $2,000, $2,250, $2,500
Support levels: $1,750, $1,500, $1,250
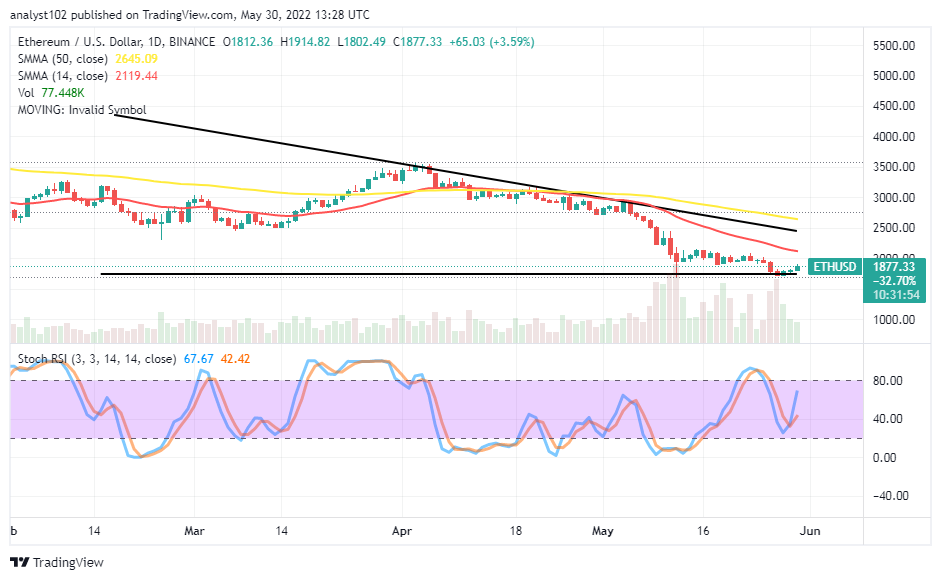
ETH/USD – Daily Chart
The daily chart reveals the ETH market price trades below the $2,000 resistance after a line of range motions that invaded the trend in a low-active manner to the downside of the $1,750 support level. The 14-day SMA indicator is beneath the 50-day SMA indicator. The horizontal line drew at the support value line to make it a pivotal baseline. The Stochastic Oscillators have crossed northbound from the range lines of 20 and 40 to swerve-reaching a 70 range. A smaller bullish candlestick is in the making to suggest the current trading situation is witnessing a buying force.
Can the ETH/USD trade push northward to obtain a higher point above the $2,000 resistance?
Likely, sooner than later, the ETH/USD trade may push northward more against the $2,000 resistance level to obtain a higher point afterward. Being as it is, the crypto economy hasn’t pushed out of a bearish-trading setting. The forces backing the upward pushes may not sustain above a trial test of the buy signal side of the 14-day SMA in the long-term run, even if there’ll be a sudden hike around it eventually.
On the downside of the technical analysis, it would be technically ideal that the ETH/USD market sellers wait for a bearish candlestick to form for confirmation of a reversal of the current upward-moving force before considering a selling order option. In the event of price moving in a slow-and-steady manner, the crypto’s worth will increase to average a higher resistant-trading zone around the $2,500 level in the long run.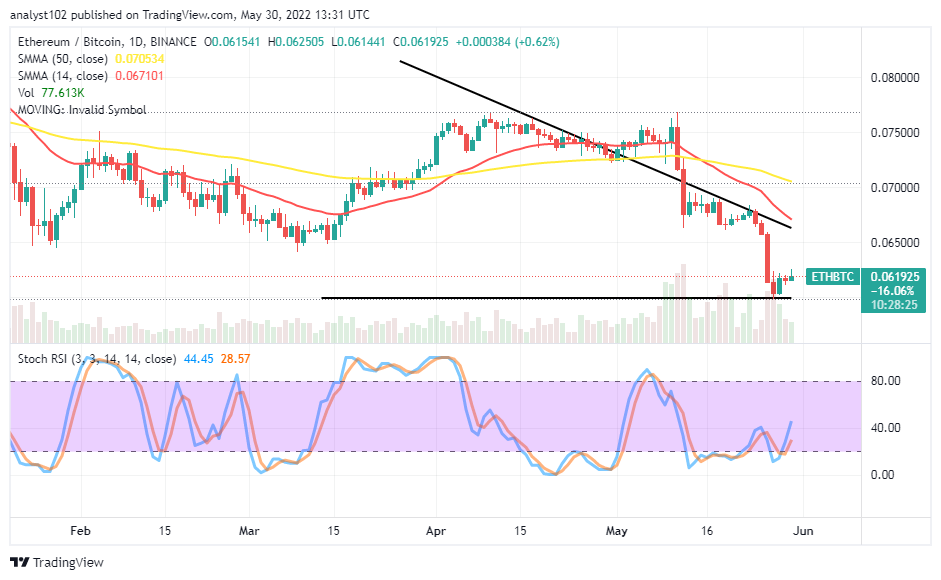
ETH/BTC Price Analysis
In the last couple of days’ sessions, Ethereum broke down significantly against a previous critical point, pairing with the trending capacity of Bitcoin. The 14-day SMA indicator has intercepted the 50-day SMA indicator from the top. The current set of trading candlesticks reflects a rejection at an early stage to indicate the base crypto has not been able to garner the required energy to shoot up against its counter-trading crypto. Therefore, it can still be a while before upspring starts returning in this pairing-trading cryptos.
Note: Cryptosignals.org is not a financial advisor. Do your research before investing your funds in any financial asset or presented product or event. We are not responsible for your investing results.
“Lucky is up more than 50% today but still more than 430% from All Time Highs!
The opportunity to bank BIG is now!
You can purchase Lucky Block here. Buy LBlock