Litecoin (LTC/USD) Markets Prolongs Downing
Estimated Reading Time: 3 minutes
Don’t invest unless you’re prepared to lose all the money you invest. This is a high-risk investment and you are unlikely to be protected if something goes wrong. Take 2 minutes to learn more

Free Crypto Signals Channel
Litecoin Price Prediction – March 15
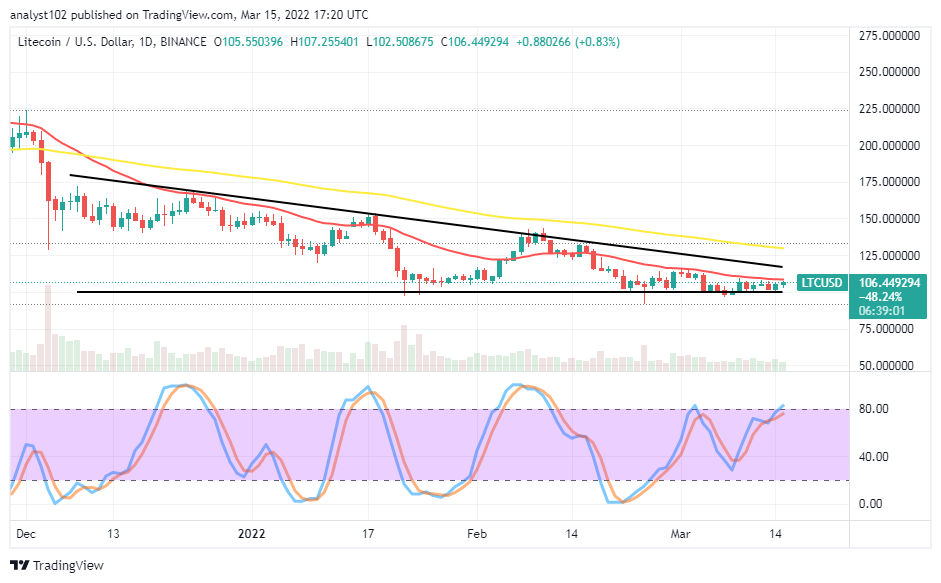
Northward pushes have not been sustainable in the LTC/USD trade operations over time as the crypto-economic market prolongs downing in its valuation. Price, as of writing, is trading around $106 between the high of $107 and $102 at a minute positive percentage of 0.83.
LTC/USD Market
Key Levels:
Resistance levels: $115, $125, $135
Support levels: $100, $95, $85
LTC/USD – Daily Chart
The LTC/USD daily chart showcases the crypto-economic market prolongs downing in a long descending triangular pattern. The bearish trend line drew between the SMAs, touching the higher resistant point to perfect its downward positioning. The 50-day SMA indicator is above the 14-day SMA indicator. The Stochastic Oscillators are around the range of 80, trying to point toward the north side to indicate an upward force is relatively ongoing.
Will price hold for long underneath the $100 support level as the crypto market prolongs downing?
A long-holding of the value-line beneath the $100 support level is not visible as the crypto-economic market prolongs downing. The ups and downs in the crypto economy have been range-bounding closely above the critical baseline at $100. The trade needs to make a short pull-down purposely to muster energy around the value-line to allow buyers to leverage on by exerting a long position afterward. The value-line remains vital in determining the re-emergence of upswings in the crypto deals.
On the downside of the technical analysis, short-position takers may have to push southward around the bearish trend line drawn at an envisaged higher resistance trading spot of about $120 in the long run. The Stochastic Oscillators are around the range of 80, seemingly signifying a near time of momentum loss. Their mode of moving in a consolidation manner at this point may cause some higher lows to occur in the wake of getting through some resistances.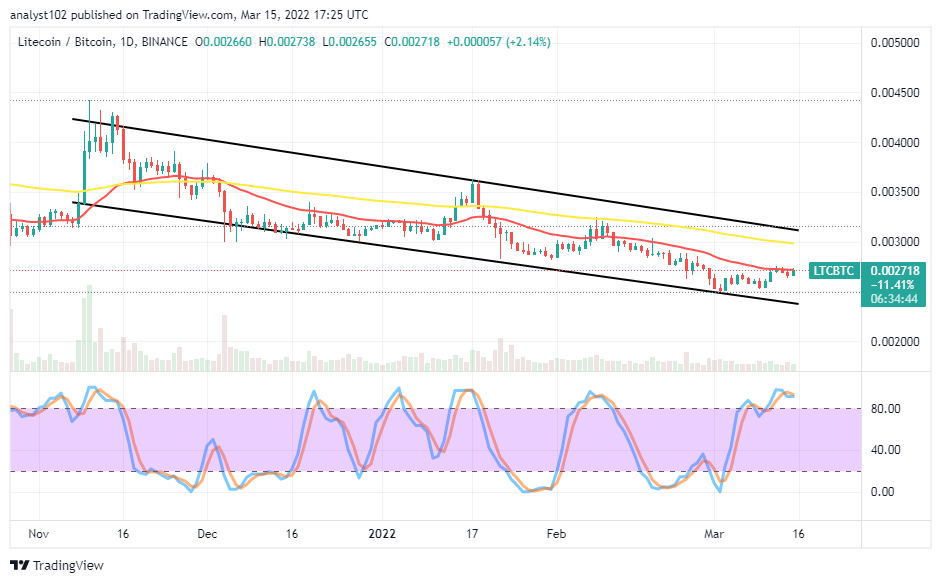 LTC/BTC Price Analysis
In comparison, Litecoin’s trending ability has not gained points against Bitcoin to denote that it is out of declining settings. In other words, the cryptocurrency pair market prolongs downing around the trend line of the smaller SMA. The 50-day SMA indicator is above the 14-day SMA indicator. The Stochastic Oscillators are in the overbought region, moving in a consolidation style. There has been a re-occurrence of smaller candlesticks around the trend line of the smaller SMA. It seems the base crypto lacks the catalyst of sustainability if it tends to push against the counter crypto.
Note: Cryptosignals.org is not a financial advisor. Do your research before investing your funds in any financial asset or presented product or event. We are not responsible for your investing results.
You can purchase Lucky Block here. Buy LBlock: