BNB Oscillates in a Range as It Is Unable to Sustain above S256
Estimated Reading Time: 2 minutes
Don’t invest unless you’re prepared to lose all the money you invest. This is a high-risk investment and you are unlikely to be protected if something goes wrong. Take 2 minutes to learn more

BNB (BNB) Long-Term Analysis: Bullish
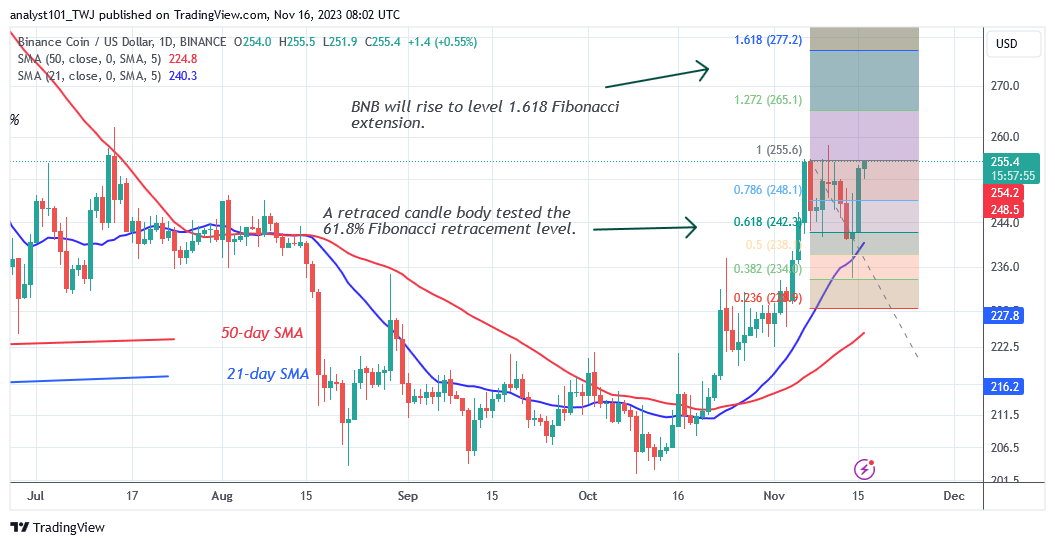
The upswing in BNB (BNB) halted on November 6 as it is unable to sustain above S256. The cryptocurrency asset is currently trading sideways, above the moving average lines but below the resistance level of $256. The present resistance level is the June 22 historical price level. Since June 22, BNB has been unable to break through the resistance level.
The coin’s value has been falling for the past four months. BNB/USD fell on August 22 and found support above the $203 level. At the time of writing, BNB is trading at $245.70. On the plus side, it is unlikely that the altcoin will rise above its recent high. Meanwhile, BNB will maintain its sideways movement between $242 and $256.
The currency’s price will trend when it breaks through the levels of support or resistance.
Technical indicators:
Major Resistance Levels – $440, $460, $480
Major Support Levels – $240, $220, $200
BNB (BNB) Indicator Analysis
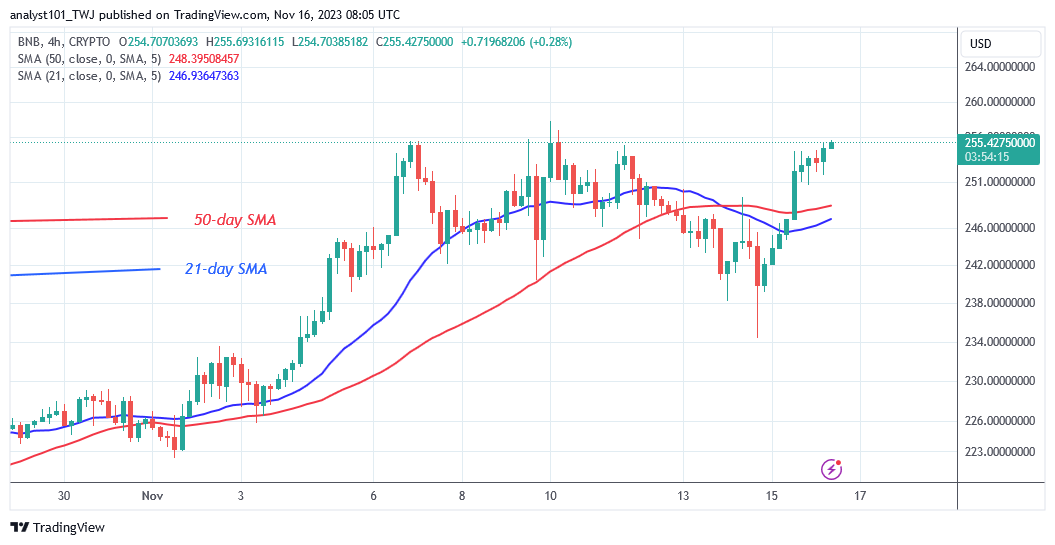
The price bars of the cryptocurrency are bouncing above the 21-day SMA as it fluctuates within its range. In the event that the 21-day SMA is broken, BNB could drop. The price of the cryptocurrency has broken below the moving average lines on the 4-hour chart due to its horizontal trend. The price bars are currently below the moving average lines, indicating that the cryptocurrency may collapse.
What Is the Next Direction for BNB (BNB)?
BNB/USD is falling as it is unable to sustain above S256. For more than a week, BNB has been oscillating between $242 and $256. According to the historical price behavior, the altcoin will fall when it approaches the resistance level. It will first fall to support above $220, then to the prior range bound zone.
You can purchase crypto coins here. Buy LBLOCK
Note: Cryptosignals.org is not a financial advisor. Do your research before investing your funds in any financial asset or presented product or event. We are not responsible for your investing result.