Chainlink (LINK) Is in a Minor Retracement, Targets the Low of $23.85
Estimated Reading Time: 2 minutes
Don’t invest unless you’re prepared to lose all the money you invest. This is a high-risk investment and you are unlikely to be protected if something goes wrong. Take 2 minutes to learn more
Chainlink (LINK) Long-Term Analysis: Bullish
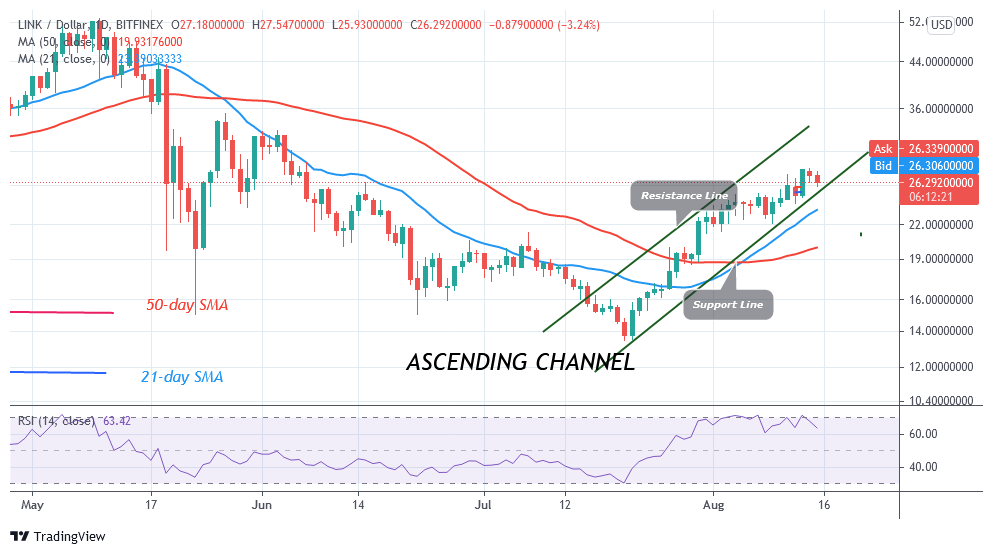
On August 14, Chainlink’s (LINK) price makes positive moves to the high of $28. The altcoin rose to an overbought region of the market. The crypto was rejected and it fell to $26.34 low. LINK price corrected upward but the selling pressure has overwhelmed the bullish momentum. The altcoin is falling after the rejection at the $27.50 high. Further downside is likely as the coin is overbought.
Chainlink (LINK) Indicator Analysis
LINK price has fallen to level 65 of the Relative Strength Index period 14. The crypto is in the bullish trend zone as sellers emerge in the overbought region. The crypto’s price is in an ascending channel. If the price retraces and breaks below the support line, the selling pressure will resume. . LINK is above the 40% range of the daily stochastic. It indicates that the coin is in a bullish momentum. This is contrary to the price action as the altcoin is falling.
Technical indicators:
Major Resistance Levels – $60, $62, $ 64
Major Support Levels – $30, $28, $26
What Is the Next Direction for Chainlink (LINK)?
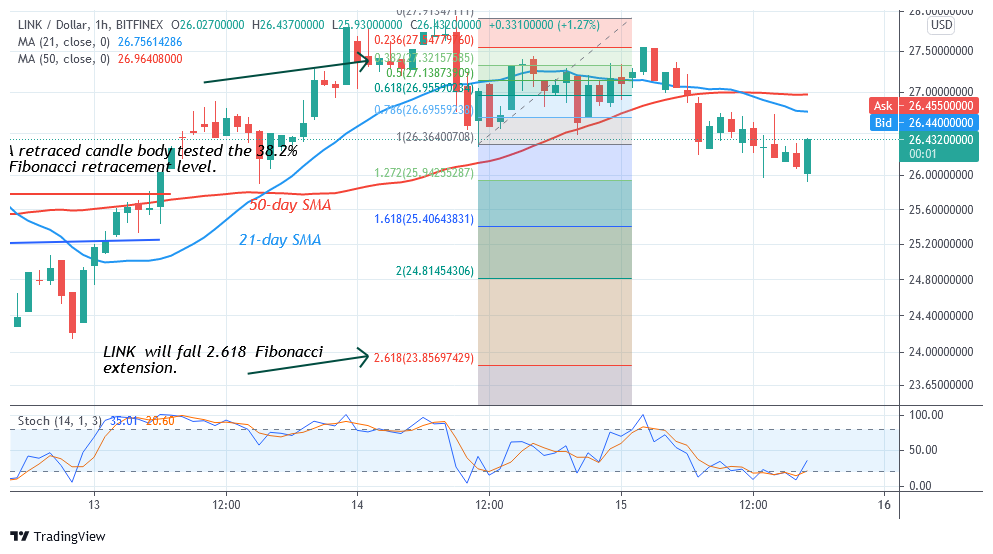
Chainlink is falling as sellers emerge in the overbought region. The Fibonacci tool has indicated a possible decline of crypto. Meanwhile, on August 14 downtrend; a retraced candle body tested the 38.2% Fibonacci retracement level. This retracement indicates that the market will fall to level 2.618 Fibonacci extensions or level $23.85.
You can purchase crypto coins here. Buy Tokens
Note: Cryptosignals.org is not a financial advisor. Do your research before investing your funds in any financial asset or presented product or event. We are not responsible for your investing result