Arbitrum Price Prediction: ARB/USD Falls Below $0.94 Level
Estimated Reading Time: 3 minutes
Don’t invest unless you’re prepared to lose all the money you invest. This is a high-risk investment and you are unlikely to be protected if something goes wrong. Take 2 minutes to learn more
The Arbitrum price prediction takes a downturn as it dips below the $0.94 threshold, signaling a potential breach below the channel.
ARB/USD Long-term Trend: Bearish (1D Chart)
Key Levels:
Resistance levels: $1.12, $1.14, $1.16
Support levels: $0.74, $0.72, $0.70
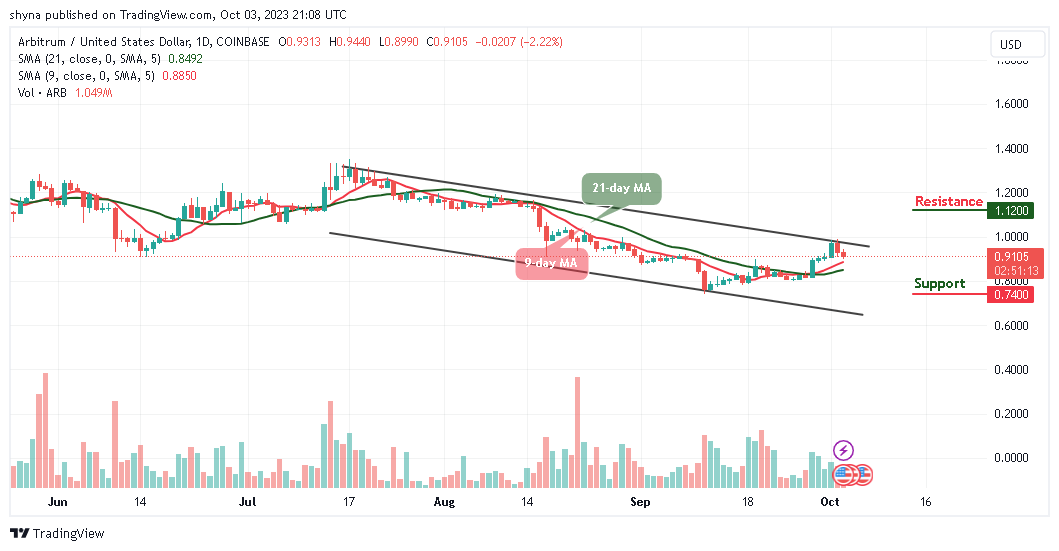
ARB/USD is currently mired in a bearish trend, with bearish sentiment dominating the broader cryptocurrency landscape. At the time of this report, the Arbitrum price is sliding toward the 9-day and 21-day moving averages, it may soon test the nearest support at $0.80.
Arbitrum Price Prediction: Potential for New Supports May Play Out
According to the daily chart, the Arbitrum price is heading southward. In this context, the primary objective for bulls is to defend the support at $0.80 and work toward pushing the price above the upper boundary of the channel. Despite the recent downtrend, today’s sharp decline has hampered buyers’ attempts to recover above the $0.92 mark.
However, if buying pressure resumes, the price could break through the upper boundary of the channel, potentially reaching the $1.00 resistance level. Should the bullish momentum continue, the next resistance levels to watch are at $1.12, $1.14, and $1.16. Conversely, if the coin remains in negative territory, further bearish movements may target support levels at $0.74, $0.72, and $0.70 respectively.
ARB/USD Medium-term Trend: Bearish (4H Chart)
On the 4-hour chart, Arbitrum is still trading below the 9-day and 21-day moving averages. Given the recent bearish indications, this trend could persist as buyers struggle to push the price above these moving averages.
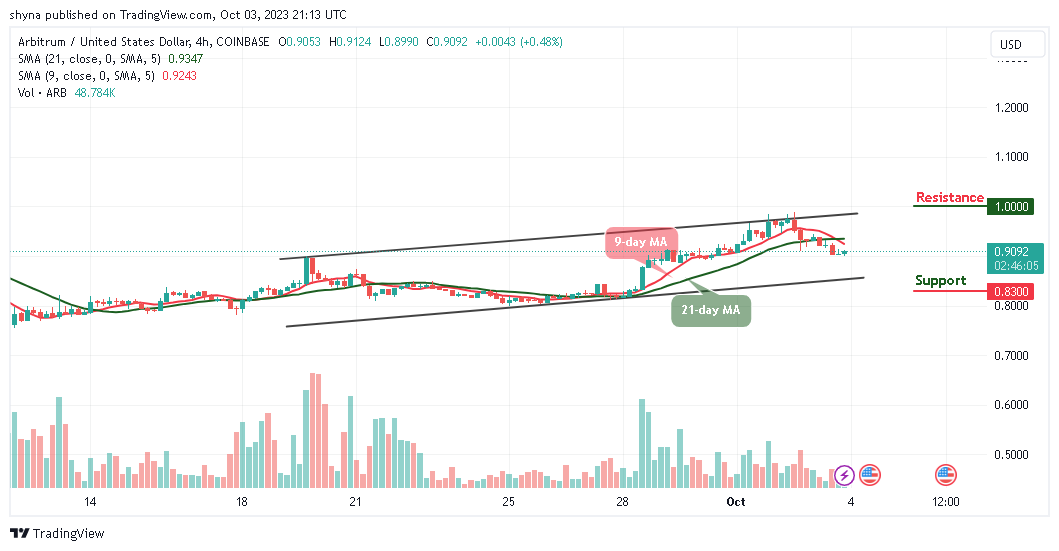
Meanwhile, the 9-day MA is crossing below the 21-day MA, indicating the bearish movement. If this continues, a bearish continuation may drive the price down to a support level of $0.83 and below. However, once ARB/USD resumes upward, it may initiate an upward trajectory toward the resistance level of $1.00 and above.
Place winning Arbitrum trades with us. Get ARB here