Lucky Block Price Prediction: LBLOCK/USD Touches $0.0077 High as Bullish Sentiment Remains Strong
Estimated Reading Time: 3 minutes
Don’t invest unless you’re prepared to lose all the money you invest. This is a high-risk investment and you are unlikely to be protected if something goes wrong. Take 2 minutes to learn more

Free Crypto Signals Channel
The Lucky Block price prediction shows that LBLOCK spikes to create additional resistance levels as the coin touches the daily high at $0.0077.
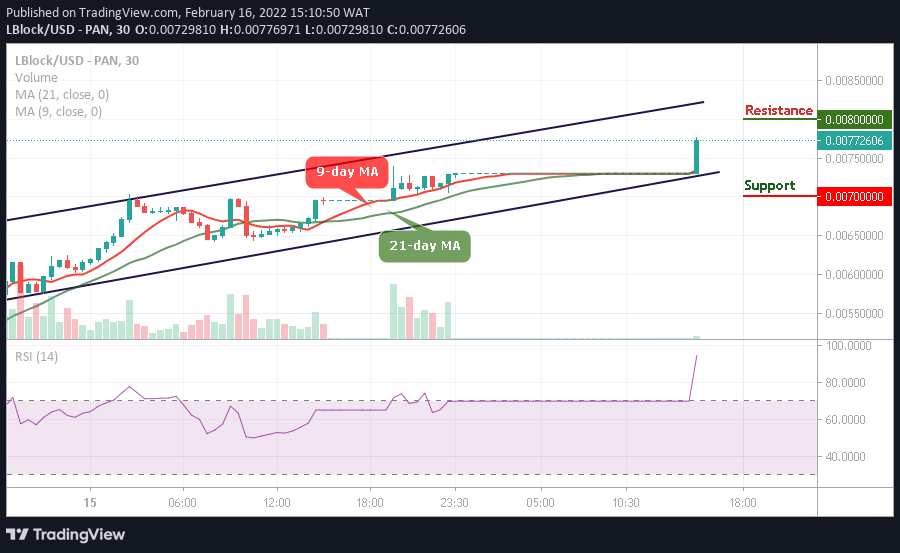
LBLOCK/USD Long-term Trend: Bullish (30 Minutes Chart)
Key Levels:
Resistance levels: $0.00800, $0.00820, $0.00840
Support levels: $0.00700, $0.00680, $0.00660
LBLOCK/USD price is trading around $0.00773 after touching $0.00776 resistance in the early hour of today. The Lucky Block price would continue to follow the uptrend if the price remains above the 9-day and 21-day moving averages. However, LBLOCK/USD would close the day on a better note as the coin prepares to touch additional resistance levels. More so, the current performance of this coin is progressive and would give room for more investments.
Lucky Block Price Prediction: What could be the Next Direction for LBLOCK?
If the Lucky Block price continues to experience an increase in volume coupled with a bullish regroup, LBLOCK/USD would hit the additional resistance levels on the upside. Otherwise, the bear may likely drag the market back a little bit for the new buyers to enter. However, the next level of support lies at $0.00700, $0.00680, and $0.00660.
According to the chart, the Lucky Block price may continue the bullish movement as the coin prepares to hit additional resistance levels at $0.00800, $0.00820, and $0.00840. The technical indicator Relative Strength index (14) remains within the overbought region which would give more positive signals into the market.
LBLOCK/USD Medium-term Trend: Ranging (15 Minutes Chart)
Looking at the 15-minute chart, the Lucky Block stays above the 9-day and 21-day moving averages as the coin is getting ready for another upward movement. Therefore, should the price break towards the upper boundary of the channel, the market may experience an upward trend which could touch the resistance level at $0.00785 and above.
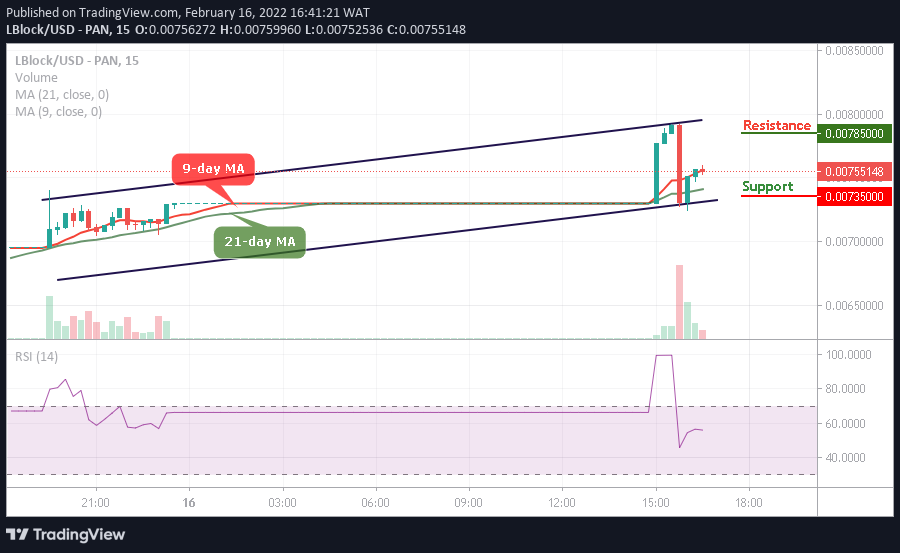
However, LBLOCK/USD trades around 9-day the moving average, any bearish cross below this barrier may hit the support at $0.00735 and below as the technical indicator Relative Strength Index (14) moves below 60-level, which may give new buying opportunities.
Read more: