Lucky Block Price Prediction: LBLOCK/USD Maintains Bullish Movement Above $0.0070
Estimated Reading Time: 3 minutes
Don’t invest unless you’re prepared to lose all the money you invest. This is a high-risk investment and you are unlikely to be protected if something goes wrong. Take 2 minutes to learn more

Free Crypto Signals Channel
The Lucky Block price prediction increases as the coin spikes above the moving averages to touch the daily high of $0.0073.
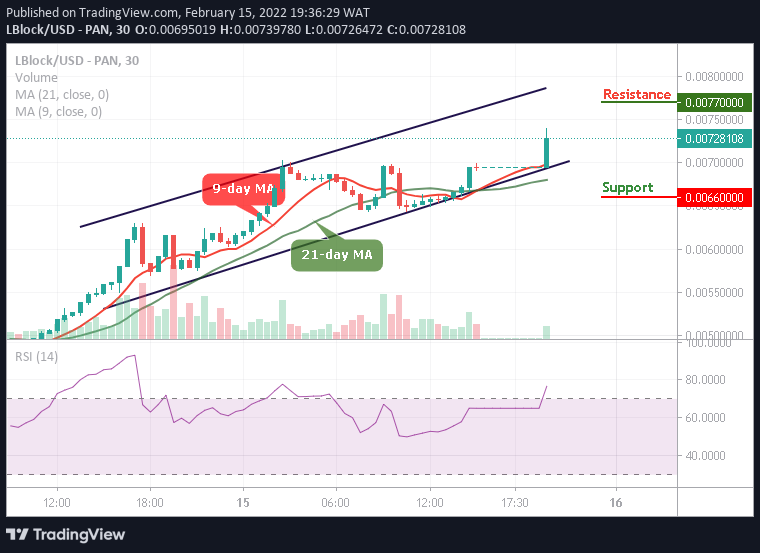
LBLOCK/USD Medium-term Trend: Bullish (30 Minutes Chart)
Key Levels:
Resistance levels: $0.00770, $0.00780, $0.00790
Support levels: $0.00660, $0.00650, $0.00640
LBLOCK/USD has repeatedly proven its potential in the market. The Lucky Block price records the highest value moving from $0.0057 to $0.0073 as at the time of writing. The ongoing trend may move higher this week, and the coin may likely touch the nearest resistance level at $0.00750 before the end of the week.
Lucky Block Price Prediction: LBLOCK/USD Trades to the Upside
According to the chart, the Lucky Block price is trading above the 9-day and 21-day moving averages. Therefore, if the bulls put more effort, they could hit potential resistance levels at $0.00770, $0.00780, and $0.00790 respectively. Moreover, should in case the bulls retreat a little, it can resume low if the bearish volatility occurs and the support levels to watch are $0.00660, $0.00650, and $0.00640 but the technical indicator Relative Strength Index (14) remains in the positive side.
LBLOCK/USD Medium-term Trend: Ranging (15 Minutes Chart)
Looking at the 15-minute chart, the Lucky Block price is following a decent rise over the past few hours, and the price appears to be on the positive side. However, if the coin falls below the 9-day and 21-day moving averages, the next level of support may surface at $0.00690 and below if the sell-off later becomes huge and gives the new buyers to come into the market.
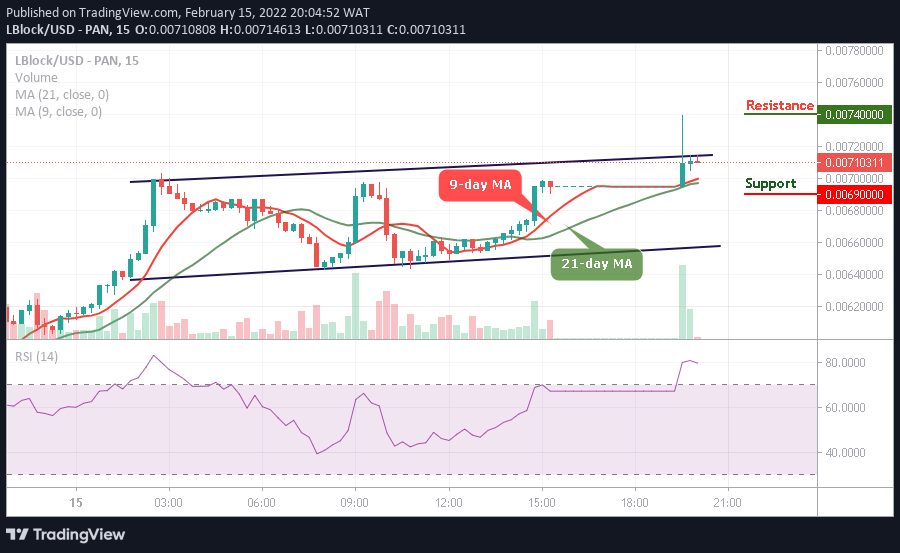
While the price remains indecisive, LBLOCK/USD trading could move to the resistance level of $0.00740 and above. According to the technical indicator Relative Strength Index (14), the coin remains at the overbought region keeping the Lucky Block price on the positive side.
Read more: