Lucky Block Price Prediction: LBLOCK/USD Price Takes the High Road; Indicating Price Rally
Estimated Reading Time: 2 minutes
Don’t invest unless you’re prepared to lose all the money you invest. This is a high-risk investment and you are unlikely to be protected if something goes wrong. Take 2 minutes to learn more

Free Crypto Signals Channel
Looking at the chart, the Lucky Block price rides the bulls as traders are ready to have a great week ahead.
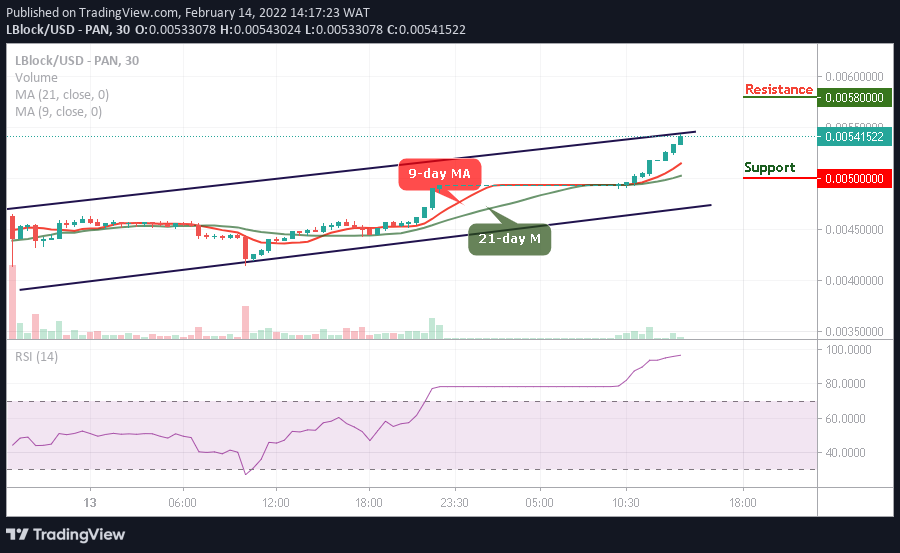
LBLOCK/USD Long-term Trend: Bullish (30 Minutes Chart)
Key Levels:
Resistance levels: $0.00580, $0.00600, $0.00620
Support levels: $0.00500, $0.00480, $0.00460
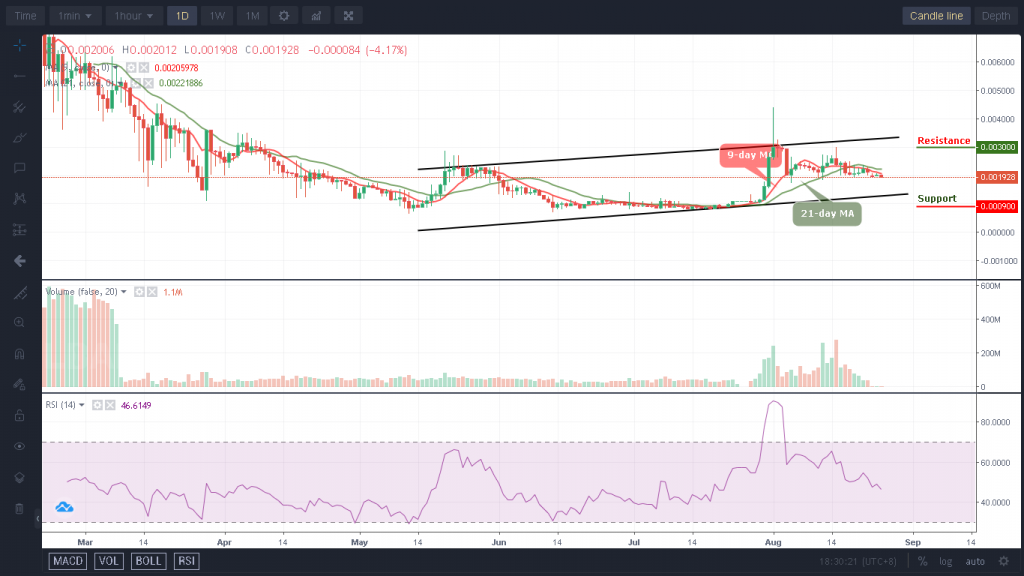
If the LBLOCK/USD trading volume increases significantly, a bullish run may continue to play out. Following the recent price, LBLOCK/USD is currently facing a potential resistance at the $195 level at the upper boundary of the channel. A break above the upper boundary of the channel would produce a huge green candle to the upside, marking resistance at $0.00580, $0.00600, $0.00620 levels. Once this is done, the Lucky Block market will follow a bullish run.
Lucky Block Price Prediction: LBLOCK (Price) Ready to Gain More Upsides
At the time of writing, the Lucky Block price remains above the 9-day and 21-day moving averages as the coin prepares to cross above the upper boundary of the channel. On the contrary, a bearish step back may likely roll the market back to the downside with a possible break down to $0.00500, $0.00480, and $0.00460 supports and this could give room for the new buyers. The technical indicator Relative Strength Index (14) keeps moving within the overbought region due to a little price increase.
LBLOCK/USD Medium-term Trend: Bullish (15 Minutes Chart)
At the opening of the market today, the Lucky Block price has been attempting to cross above the channel but as it appeared, there’s a low amount of buying pressure in the market which is why the price dropped again after touching $0.00552.

Moreover, if the bears try to break down the price, one would expect the market to touch the support level of $0.00530 and below. Meanwhile, a bullish continuation would push the price to the resistance levels of $0.00575 and above.
Read more: